AP Unit 3 Problems
34 problems for Unit 3. Try the particle picture, chemical setup and explanation before opening the separate worked solution. These are newly authored learning tasks; they are not released College Board exam questions.
Choose your next practice
Find the problems you need.
Mix the choices to focus your practice. Problem numbers and worked-solution links stay the same.
34 of 34 problems shown.
Selection: All topics and practice types.
Printing includes the currently visible selection. Reset filters first to print all 34 problems.
Problem 1
Compare intermolecular contacts in pure CH3OH, pure CH3OCH3, and CH3OCH3 mixed with water. Then describe water orientation around Cl−. Distinguish contact types from covalent bonds.
Written working workspace
Drawing is temporarily unavailable. Work on paper if needed, then record your reasoning here.
Saving written working requires JavaScript. Keep your work on paper or in your own notes; the source problem above remains available.
Problem 2
A large nonpolar molecule boils above a much smaller polar molecule.
- Explain why this is consistent with interaction models. Identify the roles of electron-cloud size and molecular contact area in dispersion.
- A comparable molecule has accessible delocalized π electron density. Explain how that feature can affect the ease of distorting its electron cloud and its London dispersion interactions. Does this feature alone establish an exact boiling-point ranking?
- Evaluate this statement and replace it with accurate wording: “London dispersion forces and van der Waals forces are interchangeable names for every attraction between neutral molecules.”
Written working workspace
Drawing is temporarily unavailable. Work on paper if needed, then record your reasoning here.
Saving written working requires JavaScript. Keep your work on paper or in your own notes; the source problem above remains available.
Problem 3
A model protein has a polar site near a nonpolar aromatic region and oppositely charged sites on two distant chain segments. Explain a possible attractive interaction in each case and how these contacts can affect shape without cleaving the chain.
Now isolate the dipole contributions using the following neutral model particles. P₁ and P₂ have permanent dipole magnitudes of 1 and 2 relative units. N₁ and N₂ are nonpolar, with polarizabilities of 1 and 3 relative units. Hold centre separation, particle size and other interaction contributions comparable; no numerical force law is required.
- Compare the dipole-induced-dipole attraction for P₁–N₁, P₁–N₂ and P₂–N₂. Rank its strength and explain which independent property changes at each step.
- Two polar pairs have identical favorable orientations and separations. One contains two P₁ particles, the other two P₂ particles. Compare their dipole–dipole contribution. For a pair of P₁ particles, sketch or describe an attractive end-to-end orientation and then an unfavorable orientation. Label the partial charges; explain why orientation matters.
- Compare two samples of neutral, similarly sized small molecules: one polar, one nonpolar. Assume comparable polarizability and packing, no hydrogen bonding and comparable favorable contacts. Which typically has stronger total intermolecular attractions? Identify the attraction shared by both and the additional contribution in the polar sample.
- For comparable separation and favorable orientation, compare a +1 ion beside the δ− end of a polar molecule with a neutral polar molecule beside that same δ− end. Which type of attraction tends to be stronger? Explain using full versus partial charge, and state why this is a qualified trend rather than an unconditional ranking of every substance.
Written working workspace
Drawing is temporarily unavailable. Work on paper if needed, then record your reasoning here.
Saving written working requires JavaScript. Keep your work on paper or in your own notes; the source problem above remains available.
Problem 4
Two molecular liquids have similar size and shape but liquid X forms extensive hydrogen bonds while Y lacks hydrogen-bond donors. At the same temperature, predict relative vapor pressures; at the same external pressure, predict boiling points. Explain why this does not automatically give an exact melting-point ranking.
Written working workspace
Drawing is temporarily unavailable. Work on paper if needed, then record your reasoning here.
Saving written working requires JavaScript. Keep your work on paper or in your own notes; the source problem above remains available.
Problem 5
Use the many-particle models A–D below. Frames show portions of extended samples, not isolated formula units. Solid lines represent covalent connectivity; dashed lines in B represent contacts between distinct molecules. Model C is a cropped diamond-network fragment: each of the two central carbon atoms has four bonds. Each outer carbon has three further bonds beyond the crop. The projection does not show exact bond angles.
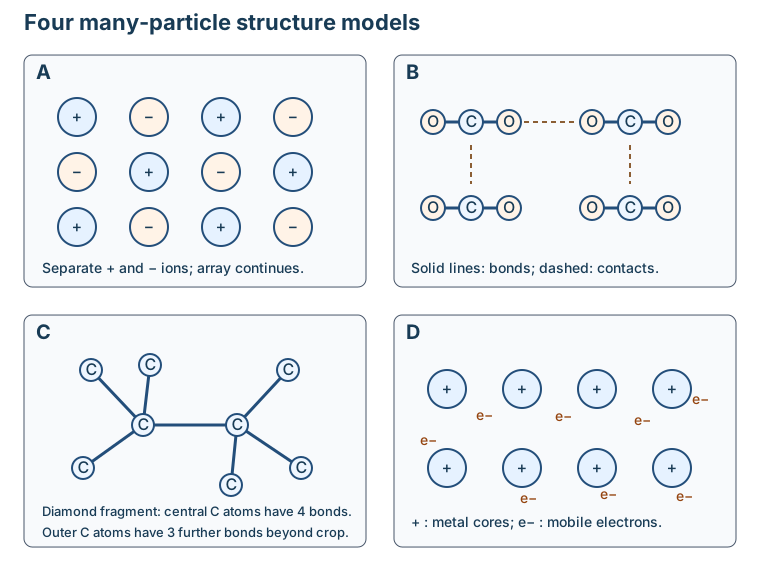
| Model | What is shown |
|---|---|
| A | A repeated array of separate alternating monovalent + and − ions. |
| B | Several intact O–C–O molecules. Covalent bonds are inside each molecule; noncovalent contacts are between molecules. |
| C | Carbon atoms joined by covalent bonds into a network that continues through the sample in three dimensions. |
| D | Repeated positive metal cores with delocalized electrons throughout the solid. |
- For A, B and D, identify the solid class and match NaCl(s), solid CO₂ and copper to the models. C is supplied as a diamond fragment: use its carbon connectivity to explain how a covalent network differs from separate molecules. Explain why multiple particles are necessary for a bulk-property model.
- For A, explain its typically high melting and boiling points and low vapor pressure, its brittleness when a layer is displaced, and why molten NaCl conducts while solid NaCl does not.
- For B, explain why a small molecular solid generally has a lower melting temperature than an ionic solid and why it ordinarily does not conduct. At a pressure where liquid CO₂ is stable, does melting CO₂ break its C–O covalent bonds?
- For C, explain the high temperature needed to disrupt a network and its hardness. State the element classes that form the AP network examples; identify one elemental and one binary-compound example. Compare diamond with graphite’s layered structure, softness and electrical conduction.
- For D, explain electrical conduction, heat conduction, malleability (flattening) and ductility (drawing into wire). Predict how interstitial guest atoms affect a metal’s deformation while it retains its delocalized electrons.
Written working workspace
Drawing is temporarily unavailable. Work on paper if needed, then record your reasoning here.
Saving written working requires JavaScript. Keep your work on paper or in your own notes; the source problem above remains available.
Problem 6
A polymer remains chemically connected after heating, but becomes more flexible. Explain a possible particle-level reason and identify evidence that would distinguish changed noncovalent contacts from cleavage of its covalent backbone.
Written working workspace
Drawing is temporarily unavailable. Work on paper if needed, then record your reasoning here.
Saving written working requires JavaScript. Keep your work on paper or in your own notes; the source problem above remains available.
Problem 7
A student draws a liquid as widely separated molecules, a gas as larger circles than the liquid, and an amorphous solid as particles moving freely past one another.
- Create four corrected, labeled particle sketches: crystalline solid, amorphous solid, liquid and gas. Preserve the same intact molecule identity and icon scale. Show spacing and motion; label whether the panels are whole samples of equal amount or equal-volume observation windows. Explain each phase’s volume/shape behavior and explicitly compare ordinary solid and liquid molar volumes.
- Create two additional liquid snapshots of the same fixed amount at T₁ and at a higher T₂, both below boiling and in the same liquid phase. Use the same icon key. Indicate the temperature change through motion arrows and explain how neighbor contacts change. Must the molecules’ covalent bonds break? Does the information justify an exact change in average spacing?
Draw on paper or in the workspace. An accessible alternative is a labeled coordinate layout that specifies particle positions, nearest-neighbor order and motion arrows; provide the same structural information rather than only phase names.
Written working workspace
Drawing is temporarily unavailable. Work on paper if needed, then record your reasoning here.
Saving written working requires JavaScript. Keep your work on paper or in your own notes; the source problem above remains available.
Problem 8
A sealed container of gas is compressed at constant temperature to half its original volume without loss of particles. Describe particle spacing, typical speed distribution, wall-collision behavior and pressure in the ideal model.
Written working workspace
Drawing is temporarily unavailable. Work on paper if needed, then record your reasoning here.
Saving written working requires JavaScript. Keep your work on paper or in your own notes; the source problem above remains available.
Problem 9
A fixed ideal-gas sample occupies 1.50 L at 0.950 atm and 27.0 °C. It is moved to 3.00 L at 127.0 °C. Find final pressure and describe a linear graph for P versus T if volume and amount were instead held fixed.
Written working workspace
Drawing is temporarily unavailable. Work on paper if needed, then record your reasoning here.
Saving written working requires JavaScript. Keep your work on paper or in your own notes; the source problem above remains available.
Problem 10
A 5.00 L ideal mixture at 298 K contains 0.100 mol He and 0.200 mol Ne. Use R = 0.08206 L atm mol−1 K−1. Find total and He partial pressure. Then add 0.100 mol Ar at fixed T,V and find the new He mole fraction and partial pressure.
Written working workspace
Drawing is temporarily unavailable. Work on paper if needed, then record your reasoning here.
Saving written working requires JavaScript. Keep your work on paper or in your own notes; the source problem above remains available.
Problem 11
At fixed n,T a pressure-volume data set is (V/L,P/atm): (1.00,4.00), (2.00,2.00), (4.00,1.00). Choose a linear graph and determine its slope. A separate gas sample collected over water has total pressure 0.980 atm and water-vapor pressure 0.031 atm; determine dry-gas pressure.
Written working workspace
Drawing is temporarily unavailable. Work on paper if needed, then record your reasoning here.
Saving written working requires JavaScript. Keep your work on paper or in your own notes; the source problem above remains available.
Problem 12
The curves below are calculated ideal Maxwell–Boltzmann speed distributions for N₂ (28.02 g mol−1) at 300 K and 675 K. Each full probability distribution is normalized over speeds from zero to infinity; the drawn window ends at 2500 m s−1. The plotted values are model calculations, not laboratory measurements.
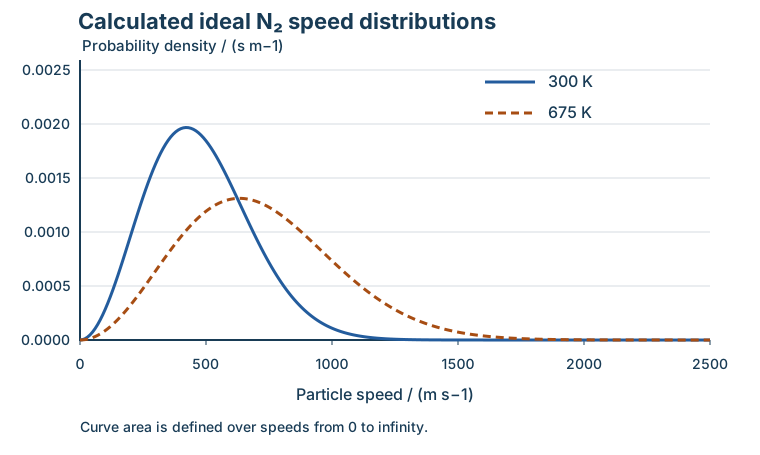
| Speed / m s−1 | Density at 300 K / s m−1 | Density at 675 K / s m−1 |
|---|---|---|
| 0 | 0 | 0 |
| 200 | 0.0009598 | 0.0003222 |
| 400 | 0.001957 | 0.0009552 |
| 600 | 0.001432 | 0.001305 |
| 800 | 0.0005281 | 0.001153 |
| 1000 | 0.0001092 | 0.0007333 |
| 1400 | 0.0000009748 | 0.0001309 |
- Use the graph to compare the peaks and spread. What does the area between two speeds mean? Compare the total areas of the complete curves; does a lower peak mean particles disappeared?
- Find the 675 K-to-300 K ratios of mean translational kinetic energy and root-mean-square speed. Distinguish speed from kinetic energy.
- For the same closed sample at fixed volume, predict the pressure ratio. Explain through particle motion and momentum transfer in wall collisions.
Written working workspace
Drawing is temporarily unavailable. Work on paper if needed, then record your reasoning here.
Saving written working requires JavaScript. Keep your work on paper or in your own notes; the source problem above remains available.
Problem 13
A student claims the speed distributions for H2 (2.00 g mol−1) and O2 (32.00 g mol−1) at 300 K must match because temperature is equal.
- Evaluate the claim and calculate vrms,H₂/vrms,O₂. Explain whether normalized translational kinetic-energy distributions at that same temperature would match.
- Construct two equal-volume whole-sample particle sketches, each with eight intact diatomic molecules of its named gas at 300 K. Use one atom/icon scale and label H and O. Include arrows in varied directions and of varied lengths within each gas; use a common speed-arrow scale to compare their typical speeds. Explain which feature encodes the distribution instead of assigning all particles one speed.
- Assuming both gases are ideal and the eight-molecule icons represent equal amounts, compare their pressures. Explain why a faster typical speed does not by itself imply higher pressure in this controlled comparison.
Use paper or the workspace. An accessible alternative is two labeled coordinate layouts that specify all molecule identities, positions and motion-arrow directions/relative lengths; a list of particle counts alone is insufficient.
Written working workspace
Drawing is temporarily unavailable. Work on paper if needed, then record your reasoning here.
Saving written working requires JavaScript. Keep your work on paper or in your own notes; the source problem above remains available.
Problem 14
An ideal calculation gives 4.00 atm for a sample at known n,V,T; the measured pressure is 3.60 atm and no liquid is present. Explain the deviation and predict how lower density at the same temperature would affect its tendency toward ideal behavior.
Written working workspace
Drawing is temporarily unavailable. Work on paper if needed, then record your reasoning here.
Saving written working requires JavaScript. Keep your work on paper or in your own notes; the source problem above remains available.
Problem 15
For matched n,V,T comparisons, gas X has PV/(nRT) = 0.82 at moderate pressure and 1.18 at very high pressure. A student says the second datum is impossible because attractions always lower pressure. Evaluate the claim and name the dominant neglected effect consistent with each datum.
Written working workspace
Drawing is temporarily unavailable. Work on paper if needed, then record your reasoning here.
Saving written working requires JavaScript. Keep your work on paper or in your own notes; the source problem above remains available.
Problem 16
0.0200 mol CaCl2 is dissolved to make 400. mL of final solution. Assume complete dissociation. Find analytical molarity, calcium and chloride concentrations, and total solute-ion count using NA = 6.022 × 10²³ mol−1.
Written working workspace
Drawing is temporarily unavailable. Work on paper if needed, then record your reasoning here.
Saving written working requires JavaScript. Keep your work on paper or in your own notes; the source problem above remains available.
Problem 17
A 15.0 mL aliquot of a 0.200 M molecular-solute stock is diluted to a final 100.0 mL. Calculate final molarity. If the flask is filled above its mark while transferring the correct aliquot, predict the concentration error and explain.
Written working workspace
Drawing is temporarily unavailable. Work on paper if needed, then record your reasoning here.
Saving written working requires JavaScript. Keep your work on paper or in your own notes; the source problem above remains available.
Problem 18
A method says “dissolve 0.100 mol solute in 1.00 L water to make exactly 0.100 M solution.” Evaluate the exactness claim and give a better volume definition. Explain how an undissolved second phase changes the classification of the overall sample.
Then classify each supplied sample as a solid, liquid or gas solution, or a heterogeneous mixture. Explain uniformity at the macroscopic sampling scale rather than using color alone.
- A single-phase substitutional Cu–Ni alloy whose composition is uniform throughout the sample.
- Completely mixed ethanol and water in one liquid phase at the stated composition.
- A uniform dry N₂–O₂ gas mixture, with no condensed phase.
- Water containing sand that settles, with composition differing between the upper liquid and the bottom layer.
Written working workspace
Drawing is temporarily unavailable. Work on paper if needed, then record your reasoning here.
Saving written working requires JavaScript. Keep your work on paper or in your own notes; the source problem above remains available.
Problem 19
Create and label two particle-window sketches of completely dissociated MgCl2 solution. Window 1 represents 1.0 volume unit with four Mg2+ icons and eight Cl− icons. Window 2 represents 2.0 volume units with six Mg2+ and twelve Cl− icons. State the common amount represented by each ion icon in a legend, mark the volume of each window, and include intact bent water molecules showing favorable hydration orientation around at least one cation and one anion. Compare concentrations and check charge neutrality. Distinguish covalent O–H bonds from noncovalent hydration contacts.
Written working workspace
Drawing is temporarily unavailable. Work on paper if needed, then record your reasoning here.
Saving written working requires JavaScript. Keep your work on paper or in your own notes; the source problem above remains available.
Problem 20
Create two labeled particle-window sketches for equal-volume solutions with the same analytical concentration of dissolved glucose and fully dissociated KCl. Choose and state a common entity-amount scale in a legend; make the relative counts consistent with the equal analytical concentrations and label both represented volumes. Preserve intact glucose molecules and water molecules; show K+/Cl− charges and favorable hydration orientations. Mark plausible noncovalent solute–water contacts without converting either solute into free atoms. Use your drawings to explain which solution is expected to conduct substantially.
Written working workspace
Drawing is temporarily unavailable. Work on paper if needed, then record your reasoning here.
Saving written working requires JavaScript. Keep your work on paper or in your own notes; the source problem above remains available.
Problem 21
A mixture of two dissolved dyes is run on polar silica with a relatively nonpolar mobile phase. Dye A travels 2.0 cm, dye B 5.0 cm, solvent front 8.0 cm. Calculate Rf, identify the more strongly retained dye and give a conditional polarity inference. Explain why filtering the original solution would not separate the dyes.
Written working workspace
Drawing is temporarily unavailable. Work on paper if needed, then record your reasoning here.
Saving written working requires JavaScript. Keep your work on paper or in your own notes; the source problem above remains available.
Problem 22
A sample contains an insoluble solid suspended in a homogeneous solution of two volatile liquids. Propose a sequence to isolate the solid and enrich the more volatile liquid. Explain the physical property each stage uses and give one reason the collected liquid might not be pure.
Written working workspace
Drawing is temporarily unavailable. Work on paper if needed, then record your reasoning here.
Saving written working requires JavaScript. Keep your work on paper or in your own notes; the source problem above remains available.
Problem 23
A student compares a dye’s Rf from yesterday’s solvent to a reference obtained in another solvent, declaring different values prove different compounds. Evaluate the claim and describe a controlled comparison.
Written working workspace
Drawing is temporarily unavailable. Work on paper if needed, then record your reasoning here.
Saving written working requires JavaScript. Keep your work on paper or in your own notes; the source problem above remains available.
Problem 24
Compare a short-chain alcohol and a much longer-chain alcohol, each with one O–H group, for relative water solubility. Then predict which would generally be more compatible with a nonpolar hydrocarbon solvent. Explain with both polar and nonpolar regions.
Written working workspace
Drawing is temporarily unavailable. Work on paper if needed, then record your reasoning here.
Saving written working requires JavaScript. Keep your work on paper or in your own notes; the source problem above remains available.
Problem 25
At 25 °C, compare equal small portions of NaCl(s) added separately to ample liquid water and to liquid n-hexane, C6H14. Water is polar and hydrogen-bonded; n-hexane is nonpolar with dispersion-dominated contacts. For this comparison, NaCl dissolves appreciably in water but negligibly in n-hexane. No reaction or complexing additive is present.
- Explain the difference by identifying contacts disrupted in the ionic lattice and each solvent, and the new contacts that stabilize ions. Include water orientation around each ion. Why cannot n-hexane stabilize separated ions as effectively here?
- Another ionic salt dissolves only slightly in water. Explain why that does not contradict water’s ion–dipole interactions.
- A different dissolution cools its surroundings. Explain whether this observation alone makes dissolution impossible. State the limits of “like dissolves like,” including what may be inferred about other nonaqueous solvents.
Written working workspace
Drawing is temporarily unavailable. Work on paper if needed, then record your reasoning here.
Saving written working requires JavaScript. Keep your work on paper or in your own notes; the source problem above remains available.
Problem 26
A data set assigns feature A to microwave radiation, B to infrared and C to visible radiation. Match each to a typical transition class and describe what energy of the species changes. Explain why none of these labels alone proves the molecule decomposed.
Written working workspace
Drawing is temporarily unavailable. Work on paper if needed, then record your reasoning here.
Saving written working requires JavaScript. Keep your work on paper or in your own notes; the source problem above remains available.
Problem 27
A student says an IR band is evidence of a new electronic configuration and a UV/visible band means an isotope became heavier. Evaluate both claims and state what kind of experiment instead gives elemental isotope abundance.
Written working workspace
Drawing is temporarily unavailable. Work on paper if needed, then record your reasoning here.
Saving written working requires JavaScript. Keep your work on paper or in your own notes; the source problem above remains available.
Problem 28
An atom emits a 4.50 × 10⁻¹⁹ J photon. Using h = 6.626 × 10⁻³⁴ J s and c = 3.00 × 10⁸ m s−1, calculate frequency and wavelength in nm. State the atom’s energy change.
Written working workspace
Drawing is temporarily unavailable. Work on paper if needed, then record your reasoning here.
Saving written working requires JavaScript. Keep your work on paper or in your own notes; the source problem above remains available.
Problem 29
An idealized species has allowed level energies 0, 3.0 × 10⁻¹⁹ and 5.0 × 10⁻¹⁹ J. Starting in the highest level, compare photon wavelengths for direct emission to the ground level and emission to the middle level. Which is shorter, and by what wavelength ratio?
Written working workspace
Drawing is temporarily unavailable. Work on paper if needed, then record your reasoning here.
Saving written working requires JavaScript. Keep your work on paper or in your own notes; the source problem above remains available.
Problem 30
Light at 600. nm is made twice as intense without changing wavelength. Evaluate a claim that its photons now have twice the energy. Calculate energy per photon and per mole of photons using h = 6.626 × 10⁻³⁴ J s, c = 3.00 × 10⁸ m s−1 and NA = 6.022 × 10²³ mol−1.
Written working workspace
Drawing is temporarily unavailable. Work on paper if needed, then record your reasoning here.
Saving written working requires JavaScript. Keep your work on paper or in your own notes; the source problem above remains available.
Problem 31
A species has ε = 250. L mol−1 cm−1 at the chosen wavelength. For b = 1.00 cm and c = 0.00200 mol L−1, find A and transmittance I/I0. Predict A if path doubles and concentration halves.
Written working workspace
Drawing is temporarily unavailable. Work on paper if needed, then record your reasoning here.
Saving written working requires JavaScript. Keep your work on paper or in your own notes; the source problem above remains available.
Problem 32
A calibration at fixed wavelength and path is A = (400. L mol−1)c + 0.015. A diluted unknown gives A = 0.255 ± 0.008. It was prepared by diluting 10.00 mL original solution to 50.00 mL final. Determine diluted and original concentrations and approximate original uncertainty; treat slope, intercept and volume ratio as fixed.
Written working workspace
Drawing is temporarily unavailable. Work on paper if needed, then record your reasoning here.
Saving written working requires JavaScript. Keep your work on paper or in your own notes; the source problem above remains available.
Problem 33
The graph and table give an original blank-corrected absorption spectrum for one dilute analyte in a 1.00 cm cuvette at fixed concentration. Assume this analyte is the only absorbing species in the wavelength region, the blank is suitable, noise is comparable across wavelengths and all readings are within the instrument’s reliable range.
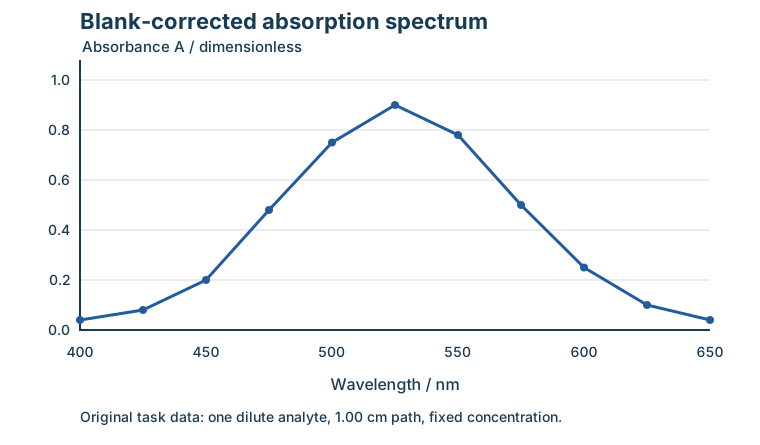
| Wavelength / nm | Absorbance A |
|---|---|
| 400 | 0.040 |
| 425 | 0.080 |
| 450 | 0.200 |
| 475 | 0.480 |
| 500 | 0.750 |
| 525 | 0.900 |
| 550 | 0.780 |
| 575 | 0.500 |
| 600 | 0.250 |
| 625 | 0.100 |
| 650 | 0.040 |
- Choose a measured wavelength for a concentration calibration that gives maximum absorbance sensitivity under these assumptions. Use the spectrum and A = εbc to explain your choice. Can this single spectrum establish the full concentration range over which the calibration is linear?
- Standards are then measured in clean 1.00 cm cuvettes at your chosen wavelength. In separate unknown trials, predict concentration-error direction for (i) a 2.00 cm cuvette without correction, (ii) accidental dilution with water without correction, and (iii) a change to a wavelength with lower ε while retaining the original calibration. Explain the absorbance and inferred-concentration changes.
Written working workspace
Drawing is temporarily unavailable. Work on paper if needed, then record your reasoning here.
Saving written working requires JavaScript. Keep your work on paper or in your own notes; the source problem above remains available.
Problem 34
A blank-corrected calibration is linear through 0.0030 M, but a 0.0060 M standard gives less absorbance than an extrapolated line predicts. An unknown lies above the validated absorbance range. Propose a defensible measurement approach and explain why forcing the high standard onto the line is inappropriate.
Written working workspace
Drawing is temporarily unavailable. Work on paper if needed, then record your reasoning here.
Saving written working requires JavaScript. Keep your work on paper or in your own notes; the source problem above remains available.