AP Unit 11 Solutions
Compare your physical setup and reasoning with these worked solutions. A numerical answer is one check; the assumptions, signs, units and representations explain what it means.
Problem 1
A metallic wire carries conventional current from left to right: 0.20 A for 3.0 s, then 0.50 A for 2.0 s, then zero for 4.0 s.
Part a
Construct the current-versus-time graph and find the charge-flow magnitude through a cross section and the number of electrons involved over the full 9.0 s.
The graph has horizontal steps at 0.20 A from 0 to 3 s, 0.50 A from 3 to 5 s, and 0 A from 5 to 9 s. Area is (0.20)(3.0) + (0.50)(2.0) = 1.60 C.
Why this step? Charge flow over each constant-current segment is IΔt; areas add.
N = 1.60/(1.60 × 10⁻¹⁹) = 1.0 × 10¹⁹ electrons.
Why this step? Count carriers using charge magnitude e, not their negative sign as a negative number of electrons.
Answer and check
Step graph with area 1.60 C; 1.0 × 10¹⁹ electrons cross in the net drift direction.
Part b
Give the electron drift direction, explain why current is not added as a spatial vector at a bend, and describe electron motion during the zero-current interval.
Electrons drift right to left, opposite conventional current. At a bend current follows the path without a vector-component reduction.
Why this step? Conventional direction is positive-charge flow, while ordinary wire carriers are negative.
During zero current the average directed flow is zero, though random microscopic carrier speeds need not vanish.
Why this step? Current measures the net crossing rate, not every individual speed.
Answer and check
Electron drift is leftward during the nonzero-current intervals; random motion can persist at zero current.
Scoring and feedback
- Score the rectangular graph area and distinguish net electron flow from random recrossings.
- a (3 points): one each for the three correct graph intervals, total area 1.60 C, and 1.0 × 10¹⁹ electrons.
- b (3 points): one each for opposite electron drift, no vector-component reduction at a bend, and random motion with zero net flow.
Problem 2
Wire A transfers 0.90 C of net charge in 0.30 s. Wire B transfers 1.20 C in 0.80 s. Each is part of an external circuit driven by a maintained battery potential difference.
Part a
Compare their currents and the charge each transfers in the next 2.0 s if its current remains constant. Explain why emf should have units of volts rather than newtons.
IA = 0.90/0.30 = 3.0 A and IB = 1.20/0.80 = 1.5 A. In 2.0 s, A transfers 6.0 C and B 3.0 C.
Why this step? The comparison uses rates, not just the previously transferred charge amounts.
Emf is energy supplied per charge, J/C = V. A maintained potential difference supports the field that drives the circuit’s net carrier motion.
Why this step? The name “electromotive force” does not make it a mechanical force.
Answer and check
IA/IB = 2; next transferred charges are 6.0 C and 3.0 C; emf is an energy-per-charge voltage.
Part b
At the same current, a wire is bent into a U shape without adding branches. Compare current through its two legs and state the relation of electron drift to current arrows.
Draw the U-shaped wire and add conventional-current and electron-drift arrows on both legs.
The same charge rate crosses both legs of an unbranched steady path. Current magnitudes are equal even though the legs point in different spatial directions.
Why this step? Steady charge conservation prohibits accumulation in the bend.
In each leg electron drift is opposite its local conventional-current arrow.
Why this step? The negative carrier sign sets the drift relation along the local path.
Answer and check
Equal leg currents; local electron drift opposes local conventional current.
In a U turned upward at the far end, current enters the first leg rightward and returns along the second leg leftward, with equal magnitudes. Electron-drift arrows point leftward on the first and rightward on the second. Other orientations are correct if arrows follow the same continuous path.
Scoring and feedback
- A rate comparison must include the time denominator. Spatial vector addition is inappropriate.
- a (3 points): one for both currents, one for the subsequent charge amounts, one for emf as J/C and the driving field.
- b (2 points): one for a created U-wire diagram with consistent conventional-current arrows and equal current magnitudes on both legs; one for opposite electron-drift arrows on both legs with the explanation that negative carriers drift opposite conventional current.
Problem 3
Build a schematic from this description: a battery connects nodes A and B; between A and B there is one resistor branch and a second branch containing a bulb and switch in series. An ideal voltmeter measures across the bulb. The switch is initially closed.
Part a
Draw the circuit with conventional-current arrows and standard symbols. Identify two complete loops and the component belonging to both. Show how to mark an adjustable resistor.
Draw the battery across A–B, a resistor across A–B, and switch–bulb in a separate A–B path. Put the voltmeter across only the bulb. Label the battery positive end A and use arrows from A toward B in the external conducting branches.
Why this step? A verbal description determines node connectivity, not positions on the page.
The loops are battery–resistor and battery–switch–bulb. The battery belongs to both. The adjustable resistor is the usual resistor symbol with a diagonal crossing arrow.
Why this step? Loops may share an element; the arrow indicates a variable element.
Answer and check
Two A–B load paths with correct standard symbols, a bulb-parallel voltmeter, and a shared battery.
Part b
Predict branch behavior when the switch opens. Does the resistor branch also stop? Can the open switch have nonzero voltage?
The bulb branch becomes open and has no steady conducting current; the independent resistor branch retains a closed battery path.
Why this step? The switch interrupts only the connections in its own branch.
The open switch can have the battery’s voltage across it, even with no branch current. An open gap is not an equal-potential connection.
Why this step? No current does not imply no potential difference.
Answer and check
The bulb goes off, the resistor branch continues conducting, and the open switch may support nonzero voltage.
Scoring and feedback
- Use the symbol reference in the lesson as needed; credit connectivity and current convention. The voltmeter must not create a conducting bypass in the ideal model.
- a (4 points): one each for correct node connectivity, meter placement, two loops with shared battery, and conventional arrows plus adjustable-element symbol.
- b (3 points): one each for stopped bulb branch, preserved resistor path, and nonzero open-gap voltage.
Problem 4
A 12 V ideal battery, closed switch, 2 Ω feed resistor, and 6 Ω load resistor form one series loop. A student adds an ideal wire across only the 6 Ω load, leaving the feed resistor in the loop, and claims the load will carry more current because the wire is “another source.”
Part a
Draw the changed topology, including the retained feed resistor. Explain and calculate the load voltage and current and the source current after the shunt is added. Relate the result to the definition of a short.
Draw the battery, switch and 2 Ω feed in series up to node B. Between B and return node D, put the 6 Ω load in parallel with an ideal wire.
Why this step? The wire changes node connectivity across the load; it adds no emf. The feed is outside the bypass.
The ideal wire makes B and D the same potential, so ΔVload = 0 and Iload = 0/6 = 0 A. The feed takes the full 12 V, so Isource = 12/2 = 6 A, all through the shunt.
Why this step? The finite feed resistor supplies the necessary voltage drop and limits current. This is a consistent short across the load.
Before the shunt, source and load current were 12/(2 + 6) = 1.5 A and load voltage was 9 V. Source current increases while load current falls to zero.
Why this step? Current in one branch is set by its own voltage, so increased source current does not imply increased current through the bypassed load.
Answer and check
Load: 0 V and 0 A. Feed and source: 6 A, with 12 V across the 2 Ω feed. The shunt bypasses the load; it does not supply energy.
Part b
Consider a separate hypothetical circuit: remove both finite resistors and connect the ideal 12 V source directly to only ideal zero-resistance wire. Why is there no sensible finite steady current? State what real effects must be restored. Explain why changing only a line’s bend differs from adding the shunt in part a.
The ideal source requires 12 V between its terminals while the ideal wire requires 0 V between the same terminals. Equivalently a loop has +12 V and no compensating drop. No finite steady solution satisfies these constraints. Restore battery internal resistance and wire/contact resistance; heating can change them.
Why this step? This diagnoses a different all-ideal direct-source short, without invalidating the finite-feed circuit in part a.
Bending a line with unchanged endpoints preserves topology; adding the shunt creates a new connection and changes the circuit.
Why this step? Circuit properties follow connectivity rather than drawing shape.
Answer and check
The all-ideal direct-source short has inconsistent voltage constraints. Nonzero real resistance is needed for a finite-current model; bending a wire with the same endpoints preserves topology.
Scoring and feedback
- Part a is a valid finite-feed circuit. Part b explicitly changes to a separate all-ideal failed model. Do not score a measured “infinite current” as a physical result.
- a (4 points): one for retained-feed/shunt topology, one for zero load voltage/current with equal-node reasoning, one for 6 A feed/source current and its 12 V drop, one for comparison with the original 1.5 A load current.
- b (2 points): one for conflicting source/wire voltage constraints and restored real resistance, one for topology versus a cosmetic bend.
Problem 5
Two wires use the same metallic material. Wire A has length L and circular radius a; wire B has length 3L and radius 2a. Both are initially at the same temperature.
Part a
Derive RB/RA. For ρ = 2.0 × 10⁻⁸ Ω·m, L = 1.0 m, and a = 0.10 mm, calculate each resistance and describe the distinction between R and ρ.
RA = ρL/(πa²) and RB = ρ(3L)/(π(2a)²), so RB/RA = 3/4.
Why this step? The radius change contributes an area factor of four.
a = 1.0 × 10⁻⁴ m gives RA = 0.637 Ω and RB = 0.477 Ω. R describes the object including geometry; ρ describes the material’s opposition to current through its atomic structure.
Why this step? Unit conversion and the material/object distinction are needed before substitution.
Answer and check
RB/RA = 3/4; RA = 0.637 Ω and RB = 0.477 Ω at the common temperature.
Part b
Wire A is heated while its geometry changes negligibly. Predict its typical metallic resistance trend and explain why an ideal constant-resistivity ohmic calculation might give a different prediction.
Real metallic ρ typically rises with temperature, so RA = ρL/A rises too at unchanged geometry.
Why this step? Temperature can alter carrier scattering and the material resistivity.
The ideal ohmic model holds R and ρ fixed, including the framework’s temperature-independent idealization. Real ohmic behavior at a fixed temperature does not establish that ρ stays unchanged across temperatures.
Why this step? These are different assumptions, not contradictory predictions about the same physical model.
Answer and check
Real metallic R usually rises; a stated ideal fixed-ρ model holds it constant. State which model is being used.
Scoring and feedback
- The radius must be converted to area; assess the model distinction explicitly rather than requiring an unqualified false temperature claim.
- a (4 points): one each for circular-area scaling, symbolic ratio 3/4, numerical resistances, and material/object distinction.
- b (2 points): one for typical real metallic temperature trend, one for the separate fixed-ρ idealization.
Problem 6
A controlled-temperature element gives these readings: (ΔV, I) = (0 V, 0 A), (1 V, 0.040 A), (2 V, 0.080 A), (3 V, 0.120 A). A heated bulb gives (1 V, 0.10 A), (2 V, 0.16 A), (3 V, 0.20 A).
Part a
Plot I versus ΔV for both elements. Determine the fixed element’s resistance and whether each data set supports one constant-R model over the tested range. Explain how changing graph axes alters the slope interpretation.
The first data lie on a straight line through zero with slope 0.040 A/V, so R = 1/slope = 25 Ω. On a ΔV-versus-I plot its slope is 25 V/A.
Why this step? Axis order controls whether slope is resistance or conductance.
For the bulb the ratios V/I are 10, 12.5, and 15 Ω, so its data do not support one constant resistance. Its I–V curve bends as the resistance changes.
Why this step? A constant R requires proportional I and V throughout the range.
Answer and check
Fixed element: R = 25 Ω and linear ohmic response. Bulb: changing effective resistance over these readings.
Part b
Design a check for heating as the cause of the bulb’s changing resistance. Identify measured variables, a temperature-related control, a repeat procedure, and where the thermal energy comes from. Contrast this with the ideal fixed-ρ model.
Measure paired I and V with ammeter in series and voltmeter across the bulb, recording temperature if a suitable sensor is available. Repeat upward/downward voltage sweeps with short readings and controlled cooldowns; keep the same bulb and meter arrangement.
Why this step? A controlled thermal history tests whether resistance depends on heating rather than a geometry change.
Electrical energy is converted to thermal energy in the filament and surroundings. Real temperature change can alter ρ, unlike the fixed-ρ ideal model. Look for reproducible differences related to temperature or cooldown, while acknowledging other nonohmic mechanisms are possible.
Why this step? The inquiry needs evidence and controls rather than assuming any curved graph proves heating.
Answer and check
A feasible repeated I–V comparison with thermal controls can test the heating explanation; electrical energy supplies the heat.
Scoring and feedback
- Do not infer a unique microscopic mechanism from curvature alone. Require actual measured variables and controls.
- a (4 points): one each for plotted data, reciprocal slope resistance, reversed-axis interpretation, and bulb ratio/curvature diagnosis.
- b (3 points): one each for paired measurements, concrete thermal controls/repeats, and electrical-to-thermal explanation with model limitation.
Problem 7
A 30 Ω ohmic resistor is connected across a 6.0 V ideal source for 120 s. Assume resistance remains constant.
Part a
Derive the resistor forms of power from P = IΔV, then find current, power, and converted energy.
Substitute ΔV = IR to get P = I²R; substitute I = ΔV/R to get P = (ΔV)²/R.
Why this step? Both derived forms rely on the element’s ohmic relation.
I = 6.0/30 = 0.20 A, P = 36/30 = 1.2 W, and energy = (1.2)(120) = 144 J.
Why this step? Use the resistor’s own voltage and power as rate of energy conversion.
Answer and check
I = 0.20 A, P = 1.2 W, converted energy = 144 J.
Part b
Compare power if source voltage doubles with R fixed, and if resistance doubles with source voltage fixed. Create two qualitative graphs: P versus positive V with R fixed, and P versus positive R with V fixed. Label axes and explain each shape.
Doubling V gives four times the power, 4.8 W. Doubling R at fixed 6 V gives half the power, 0.60 W.
Why this step? P = V²/R contains the distinct quadratic and inverse dependences.
P-versus-V at fixed R is quadratic through zero; P-versus-R at fixed V is a decreasing inverse curve for positive R.
Why this step? A graph represents the selected controlled comparison.
Answer and check
Voltage doubling: ×4 power; resistance doubling at fixed voltage: ×1/2.
Scoring and feedback
- Score the derivation and the held-fixed quantities.
- a (4 points): one for each derived resistor-power form, one for current/power, one for 144 J with time relation.
- b (3 points): one each for ×4 voltage effect, ×1/2 resistance effect, and the two correct graph shapes.
- b: require two created qualitative graphs with labeled axes: increasing convex P∝V² at fixed R and decreasing P∝1/R for positive R at fixed V.
Problem 8
Two bulbs have stipulated constant resistances RA = 4 Ω and RB = 8 Ω. They are used with an ideal 12 V supply. Treat power as a qualitative brightness guide for these modeled bulbs.
Part a
Connect them in series. Find each power, rank brightness, and explain the fixed-current comparison.
I = 12/(4 + 8) = 1 A through both. PA = I²RA = 4 W and PB = 8 W.
Why this step? Series bulbs share current, not voltage.
The model predicts B brighter because its larger resistance converts more power at the same current.
Why this step? Under this constraint P is proportional to R.
Answer and check
Series: A 4 W, B 8 W; modeled B is brighter.
Part b
Reconnect them in parallel across 12 V. Find each power, rank brightness, and explain why the ranking reverses. State a limitation for real bulbs.
Both have 12 V. PA = 144/4 = 36 W and PB = 144/8 = 18 W.
Why this step? Parallel branches share voltage, so power varies inversely with R.
The model predicts A brighter. Actual incandescent resistance changes with temperature, and visible brightness is not quantitatively comparable solely from power across different bulb designs.
Why this step? A model-based ranking requires assumptions about resistance and comparable light conversion.
Answer and check
Parallel: A 36 W, B 18 W; modeled A is brighter under the fixed-resistance assumption.
Scoring and feedback
- This is a stipulated model, not advice to connect real rated bulbs at these powers. Require the changed constraint.
- a (3 points): one each for equal series current, powers 4 W/8 W, and brightness justification.
- b (3 points): one each for shared 12 V, powers 36 W/18 W and reversed ranking, and real-bulb model limitation.
Problem 9
An ideal 18 V battery supplies a 3 Ω resistor in series with a parallel combination of 6 Ω and 12 Ω. A switch can add another 12 Ω branch in parallel with that combination.
Part a
With the added branch open, find equivalent resistance, source current, branch currents, and voltage drops. Explain the topology behind each equality.
First draw and label the node schematic and branch-current arrows.
Rp = (6 × 12)/(6 + 12) = 4 Ω; Req = 3 + 4 = 7 Ω. Itotal = 18/7 A.
Why this step? Parallel conductances add; the 3 Ω feed is in series with the group.
The feed drop is 54/7 V, leaving 72/7 V across both branches. I6 = 12/7 A and I12 = 6/7 A; their sum is 18/7 A.
Why this step? Expand using equal parallel voltage and equal series current.
Answer and check
Req = 7 Ω; Itotal = 18/7 A ≈ 2.57 A; branch currents 12/7 A and 6/7 A; branch voltage 72/7 V.
Part b
Close the extra 12 Ω branch. Predict and calculate the new equivalent resistance, source current, and original 6 Ω branch current. Why does original branch current change here even though the battery is ideal?
1/Rp′ = 1/6 + 1/12 + 1/12 = 1/3, so Rp′ = 3 Ω and Req′ = 6 Ω. Source current becomes 3 A.
Why this step? An added parallel path reduces the group resistance.
The feed now drops 9 V, leaving 9 V across the group. Original 6 Ω current is 1.5 A, smaller than 12/7 A.
Why this step? The fixed battery voltage is across the entire network; the shared feed resistor makes the group voltage depend on total current.
Answer and check
Req′ = 6 Ω, source current 3 A, original 6 Ω current 1.5 A. The upstream series drop increases.
Scoring and feedback
- The original branch is not directly across the battery, so adding a parallel branch can reduce its voltage through the shared feed resistance.
- a (4 points): one for the created labeled node/current schematic and correct series-parallel reduction; one for source current; one for group voltage; one for branch currents and their sum matching source current.
- b (3 points): one each for new equivalent/source current, original branch current, and feed-drop explanation.
Problem 10
A battery has emf 12 V and internal resistance 2.0 Ω. Its external loop has a 9.0 Ω load and a total 1.0 Ω of wire resistance. Meters are ideal unless the part asks otherwise.
Part a
Find current, loaded terminal voltage, load voltage, and open-circuit terminal voltage. Explain when wire resistance may be neglected and why it is retained here.
Total resistance = 2 + 9 + 1 = 12 Ω; I = 1 A. Vterminal = ε − Ir = 12 − 2 = 10 V. The load voltage is 9 V and the wire drop 1 V.
Why this step? Internal and external resistances form one series path, but terminal voltage spans only the external path.
Open-circuit current is zero, so terminal voltage equals emf, 12 V. Wire resistance may be neglected when much smaller than other finite resistances; here it causes a stated 1 V drop and should be retained.
Why this step? The ideal-wire approximation is relative and cannot describe a short by removing every current limit.
Answer and check
I = 1 A; Vterminal = 10 V; Vload = 9 V; open-circuit voltage = 12 V.
Part b
Draw and label the complete connected meter schematic: an ammeter to measure load current and a voltmeter to measure load voltage. State ideal meter resistances and qualitatively discuss nonideal meter effects.
The ammeter is inserted in series with the load; the voltmeter is connected across the load’s two terminals. Ideal ammeter R = 0, ideal voltmeter R approaches infinity.
Why this step? Each connection matches the quantity’s definition without changing the ideal circuit.
A nonideal ammeter adds series resistance and reduces current. A finite-resistance voltmeter adds a parallel load path, increasing demand through the upstream resistance and potentially reducing the load voltage. These are qualitative effects; no numerical loading calculation is required.
Why this step? Meters themselves alter topology and voltage division when their resistance is nonideal.
Answer and check
A in series, V in parallel; ideal resistances 0 and infinite. Nonideal meters can disturb the values being measured.
Scoring and feedback
- Do not confuse battery terminals with load endpoints. Require qualitative meter effects only.
- a (4 points): one each for full series resistance, loaded terminal voltage, load/wire voltage split, and open-circuit/emf plus wire-model distinction.
- b (3 points): one each for meter connections, ideal resistances, and qualitative nonideal disturbance.
Problem 11
A single loop contains an ideal battery and two resistors. Traversing with the measured 2.0 A current, a potential graph reads: before battery 4 V; after battery 16 V; after the first resistor 10 V; after the second resistor back to 4 V. Wires are ideal.
Part a
Find emf and both resistances, construct the signed loop equation, and explain how the graph tests energy conservation.
The source rise is +12 V; resistor drops are −6 V and −6 V. Each resistance is |ΔV|/I = 6/2 = 3 Ω.
Why this step? Only voltage differences matter; the arbitrary initial 4 V is a reference offset.
The loop equation is 12 − (2)(3) − (2)(3) = 0. The graph returns to its starting height, as required for one potential at the starting point.
Why this step? A closed-loop potential sum is the energy-per-charge conservation ledger.
Answer and check
Emf 12 V; both resistances 3 Ω; +12 − 6 − 6 = 0.
Part b
For 0.50 C passing through this loop, give the source energy input and conversion in each resistor. Create a quantitative potential-versus-position graph with labeled components and voltage scale if the starting reference becomes 0 V.
The source provides (0.50)(12) = 6.0 J; each resistor converts (0.50)(6) = 3.0 J.
Why this step? Energy transfer is charge times the magnitude of the relevant voltage change.
Subtract 4 V from every graph height: 0 → 12 → 6 → 0 V. The drops and current remain the same.
Why this step? Reference changes shift absolute potential without altering physical differences.
Answer and check
Source 6 J; each resistor 3 J; shifted graph 0, 12, 6, 0 V.
Scoring and feedback
- Score the reference shift and explicit energy-per-charge reasoning.
- a (3 points): one each for emf/resistances, signed loop equation, and graph closure.
- b (3 points): one each for source energy, resistor energies, and consistent reference shift.
- a supplies read/interpret and calculation evidence; b supplies the created quantitative graph with potential scale and ordered component positions.
Problem 12
A 15 V ideal battery sends current I0 through a 2 Ω feed resistor to a junction. From that node, currents I1 through 3 Ω and I2 through 6 Ω return to the negative source node. All assumed currents follow source-driven conventional directions.
Part a
A student writes 15 − 2I0 − 3I1 − 6I2 = 0 as a single-loop equation. Explain the path error, write two independent correct loops and one junction equation, and solve the three currents.
Draw and label the source, feed, both return branches and the three assumed current directions before writing equations.
The student crosses both separate outgoing parallel paths in one source-return traversal, which is not the stated physical loop. Correct equations are 15 − 2I0 − 3I1 = 0 and 15 − 2I0 − 6I2 = 0, with I0 = I1 + I2.
Why this step? Every voltage term must correspond to an element encountered along an actual closed path.
Subtract loops: 3I1 = 6I2, so I1 = 2I2 and I0 = 3I2. Then 15 − 6I2 − 6I2 = 0 gives I2 = 1.25 A, I1 = 2.50 A, I0 = 3.75 A.
Why this step? Loop and junction constraints jointly determine branch rates.
Answer and check
I0 = 3.75 A, I1 = 2.50 A, I2 = 1.25 A, from two valid independent loops and a junction equation.
Part b
Write the loop going down the 3 Ω branch and up the 6 Ω branch. Is it independent? Create a labeled qualitative potential-versus-ordered-position graph through the source, feed, and 6 Ω return branch with source negative terminal set to zero; mark the calculated plateau potentials.
The branch-to-branch loop is −3I1 + 6I2 = 0. It is obtained by subtracting the two source loops, so is a consistency check rather than an independent equation.
Why this step? Independent relations contain new algebraic information.
The graph is 0 → 15 → 7.5 → 0 V, since the feed drop is (3.75)(2) = 7.5 V and branch drop (1.25)(6) = 7.5 V.
Why this step? The signed potential walk returns to its starting node.
Answer and check
−3I1 + 6I2 = 0 is dependent; graph heights are 0, 15, 7.5, 0 V.
Scoring and feedback
- Require real branch paths and independent equations; merely reducing equivalent resistance does not answer the equation-construction task.
- a (4 points): one for a created feed/two-return schematic with current arrows and the path-error diagnosis; one for two correct independent loops; one for the junction equation; one for all solved currents.
- b (2 points): one for dependent-loop explanation; one for the created labeled potential graph with correct plateau heights and return to its starting potential.
Problem 13
At a steady junction, branch A brings in 4.0 mC every 2.0 ms, branch B brings in 0.50 A, and branch C takes out 1.20 A. The direction of unknown branch D is initially assumed outward.
Part a
Find ID and the charge leaving through D in 5.0 s. State the conservation principle used.
IA = 4.0 × 10⁻³/(2.0 × 10⁻³) = 2.0 A. Junction rule gives 2.0 + 0.50 = 1.20 + ID, so ID = 1.30 A outward.
Why this step? Steady charge conservation requires incoming and outgoing rates to balance.
Charge-flow magnitude through D in 5 s is (1.30)(5.0) = 6.50 C.
Why this step? Convert the conserved rate to a charge amount over the specified common time.
Answer and check
ID = 1.30 A outward; 6.50 C leaves via D in 5 s.
Part b
If a student instead reports ID = 0.80 A outward, find the predicted accumulation rate in the junction region and explain why this is inconsistent with steady conditions.
Incoming total is 2.50 A; the reported outgoing total is 1.20 + 0.80 = 2.00 A. Net accumulation rate would be 0.50 C/s.
Why this step? Any imbalance equals charge change per time inside the selected region.
A growing charge distribution changes electric fields and redistributes currents, so that imbalance cannot describe the stipulated steady node.
Why this step? The simple junction rule assumes no continued charge accumulation.
Answer and check
The report implies +0.50 C/s accumulation and violates the steady-junction assumption.
Scoring and feedback
- Score conversion from millisecond charge flow and the explicit accumulation interpretation.
- a (3 points): one each for incoming-rate conversion, outward 1.30 A, and 6.50 C with conservation.
- b (2 points): one for 0.50 C/s imbalance, one for incompatibility with a steady node.
Problem 14
A node has measured branch currents 1.4 A inward in A, 0.8 A outward in B, and 1.0 A outward in C. Unknown D is drawn outward. Farther along B, its wire bends 90° and passes through two series resistors without any new junction.
Part a
Solve the signed current in D and redraw its actual direction. Compare both incoming and outgoing totals after correction.
1.4 = 0.8 + 1.0 + ID, so ID = −0.4 A relative to the assumed outward arrow.
Why this step? Keep the assumed direction consistent throughout the signed equation.
D actually brings in 0.4 A. Incoming total 1.4 + 0.4 = 1.8 A equals outgoing 0.8 + 1.0 = 1.8 A.
Why this step? A negative solution reverses the assumed direction and the physical totals verify conservation.
Answer and check
ID = −0.4 A as drawn; actual D is 0.4 A inward.
Part b
Find current through both series resistors in B. Explain why neither the bend angle nor the first resistor’s heating reduces the second resistor’s current.
Both carry 0.8 A because there is no alternative path or sustained accumulation between them.
Why this step? The junction rule on each connecting region enforces the same series current.
Angles do not change a scalar flow rate, and resistor heating converts energy rather than consuming charge.
Why this step? Charge conservation differs from energy transfer.
Answer and check
0.8 A in both resistors; the bend and energy conversion do not consume current.
Scoring and feedback
- Require an actual direction, not a negative magnitude described as outward.
- a (3 points): one each for signed equation, reversed actual direction, and equal 1.8 A totals.
- b (2 points): one for both 0.8 A series currents, one for distinguishing angle and energy transfer from charge loss.
Problem 15
Capacitors of 2 μF and 6 μF can be connected in series or parallel across a 12 V source. Both initially are uncharged and isolated intermediate nodes start neutral.
Part a
For the series connection, derive Ceq, find each charge and voltage, and explain why equal charge magnitude follows from conservation. Compare Ceq to the smaller capacitor.
1/Ceq = 1/2 + 1/6 in μF⁻¹, so Ceq = 1.5 μF. Source-side charge Q = CeqV = 18 μC.
Why this step? The same magnitude of charge appears on each capacitor in the standard series string.
V2 = Q/2 = 9 V and V6 = Q/6 = 3 V. The initially neutral floating intermediate conductor has equal and opposite induced plate contributions, giving equal series Q. The equivalent 1.5 μF is less than 2 μF.
Why this step? Voltages add while the intermediate node cannot acquire net charge from outside.
Answer and check
Series: Ceq = 1.5 μF; Q = 18 μC each; voltages 9 V and 3 V.
Part b
Reconnect the uncharged capacitors in parallel across 12 V. Find Ceq and each plate-charge magnitude, and explain how the equivalent represents the source’s total charge separation.
Ceq = 2 + 6 = 8 μF. Both capacitor voltages are 12 V, so Q2 = 24 μC and Q6 = 72 μC.
Why this step? Parallel components share the source’s two endpoint potentials.
Total source-side charge is 24 + 72 = 96 μC = (8 μF)(12 V).
Why this step? Adding branch charges at the same voltage defines the parallel equivalent.
Answer and check
Parallel: Ceq = 8 μF; individual charge magnitudes 24 μC and 72 μC; total source-side magnitude 96 μC.
Scoring and feedback
- Do not equate series capacitor voltages. State the initially neutral intermediate-node condition.
- a (4 points): one each for series equivalent, equal charge with neutral-node reasoning, individual voltages, and smaller-than-minimum check.
- b (3 points): one each for parallel equivalent, individual shared-voltage charges, and total source-side charge check.
Problem 16
An ideal 10 V source charges an initially uncharged 200 μF capacitor through a 5.0 kΩ resistor. A switch later removes the source and allows the capacitor to discharge through the same resistor.
Part a
Find the charging time constant and initial and long-time values of current, capacitor voltage, charge, and stored energy. Explain the initial wire and final open-branch models.
τ = RC = (5000)(200 × 10⁻⁶) = 1.0 s. Initially VC = 0, Q = 0, U = 0, and I = 10/5000 = 2.0 mA.
Why this step? An initially uncharged capacitor has zero voltage, equivalent to a wire for this instant only.
At long time I = 0, VC = 10 V, Q = 2.0 mC, and U = ½(200 × 10⁻⁶)(10)² = 10 mJ.
Why this step? A fully charged ideal capacitor blocks steady branch current; the resistor drop approaches zero.
Answer and check
τ = 1.0 s; initial (I, VC, Q, U) = (2.0 mA, 0, 0, 0); long-time values = (0, 10 V, 2.0 mC, 10 mJ).
Part b
Sketch charging Q, VC, current magnitude, and energy against time, indicating endpoint behavior and the meaning of one τ. Compare qualitatively if R doubles with all else fixed. Do not use a transient formula.
Q and VC rise from zero and flatten toward final values; |I| starts at its maximum and decreases toward zero; U rises toward 10 mJ. At one τ, charge is about 63% of its final value.
Why this step? As capacitor voltage rises, less source voltage remains across the resistor and current decreases.
Doubling R doubles τ and halves initial current, stretching the approach to the same final charge, voltage, and energy.
Why this step? Resistance controls the rate while the ideal source and C set the final charged state.
Answer and check
Flattening rise for Q and VC, flattening fall for |I|; slower curves but unchanged charged endpoints when R doubles.
Part c
After it is fully charged, switch to discharge. State initial current direction and magnitude, describe immediate and long-time changes in charge and energy, and explain the 37% landmark.
Create labeled qualitative discharge graphs of Q, VC, current magnitude and stored energy against time, showing their starting values and zero asymptotes.
Initially the voltage remains 10 V, so |I| = 2.0 mA, with direction opposite charging through the resistor. Charge magnitude and stored energy begin decreasing immediately.
Why this step? Stored separated-charge energy now drives the circuit instead of a connected source.
Q, VC, |I|, and U all approach zero; charge is about 37% of its initial magnitude after one τ. Lost stored energy becomes resistor heating. At times much longer than τ use the zero-current, zero-voltage endpoint.
Why this step? Discharge curves approach steady zero values and obey energy conservation.
Answer and check
Initial discharge |I| = 2.0 mA in reverse; all capacitor quantities approach zero, with about 37% charge remaining after 1.0 s.
Scoring and feedback
- No exponential/logarithmic elapsed-time algebra is required or credited as necessary. Sketches should have labeled axes, initial values, correct trends, and asymptotes.
- a (4 points): one each for τ, initial state, final charge/voltage/current, and final energy with endpoint models.
- b (3 points): one each for correct qualitative curve trends, 63% landmark, and doubled-R comparison.
- c (3 points): one each for initial reverse current, decrease and zero endpoint, and 37%/thermal-energy explanation.
Problem 17
A student tests a resistor with ideal meters and a low-voltage source. I-versus-ΔV data yield best-fit slope 0.020 A/V, with plausible uncertainty bounds 0.019 to 0.021 A/V. At 4.0 V the measured current is 0.080 A. The resistor is a uniform sample 0.10 m long with cross-sectional area 2.0 × 10⁻⁸ m².
Part a
Design a coherent measurement procedure to collect the current–voltage data: identify the connected meters, varied and measured quantities, temperature and geometry controls, repeated readings, and a test of constant R. Then infer resistance and a range from the supplied slope bounds and calculate resistivity.
Assemble a low-voltage source, adjustable series control, ammeter in series with the sample and voltmeter across the sample. Vary voltage through several safe settings, measure paired sample voltage and current after a consistent short interval, and repeat settings in increasing and decreasing order. Keep sample dimensions and ambient conditions fixed; allow cooling between runs or monitor temperature. Plot I against sample ΔV and check whether a straight line through the origin describes repeated data within uncertainty.
Why this step? A procedure connects the apparatus, independent and measured variables, controls, repeat method and model test. Heating must be controlled before interpreting a slope as one fixed resistance.
Place the ammeter in series and voltmeter across the resistor. Use low currents and repeat paired I–V measurements after cooldown while keeping material and geometry fixed.
Why this step? Correct placement and thermal control avoid confusing meter disturbance or heating with material response.
R = 1/0.020 = 50 Ω. Bounds reverse on reciprocation: 1/0.021 = 47.6 Ω to 1/0.019 = 52.6 Ω. ρ = RA/ℓ = 1.0 × 10⁻⁵ Ω·m.
Why this step? Slope of I versus voltage is inverse resistance; geometry then separates ρ from R.
Inspect residuals for curvature and compare ascending/descending low-voltage sweeps at controlled temperature. State the fixed-ρ idealization when applying one R.
Why this step? A fit requires evidence that one proportional model describes the measured range.
Answer and check
R ≈ 50 Ω, plausible range 47.6–52.6 Ω; ρ ≈ 1.0 × 10⁻⁵ Ω·m in the controlled-temperature model.
Part b
At the stated 4.0 V operating point, find power and charge transferred in 30 s. Find converted energy two ways and explain why heating can change later readings.
P = IΔV = (0.080)(4.0) = 0.32 W; Δq = IΔt = 2.4 C.
Why this step? Current is a charge rate and power is an energy rate.
Energy = PΔt = 9.6 J, also ΔqΔV = (2.4)(4) = 9.6 J. Thermal conversion can raise the resistor’s temperature and change real material resistivity, so later I–V points may differ.
Why this step? Energy and charge methods should agree while thermal feedback can limit the fixed-R model.
Answer and check
P = 0.32 W, Δq = 2.4 C, energy = 9.6 J; heating can invalidate the original fixed-temperature resistance.
Scoring and feedback
- Use reciprocated uncertainty bounds correctly. Meter imperfections are qualitative in this unit; the data already stipulate ideal meters.
- a (4 points): one each for meter/control design, slope reciprocal and reversed bounds, resistivity, and model-testing procedure.
- b (3 points): one each for power/charge, two agreeing energy methods, and heating limitation.
- a: the procedure point requires apparatus connectivity, voltage/current measurements, controls, repeated readings and the constant-R model test; naming only meter types is insufficient.
Problem 18
A 12 V ideal source fixes node A at 12 V and node D at 0 V. Left path A→B→D has R1 = 2 Ω and R2 = 4 Ω. Right path A→C→D has R3 = 4 Ω and R4 = 2 Ω. A bridge resistor R5 = 4 Ω joins B to C. Assume currents I1 A→B, I2 B→D, I3 A→C, I4 C→D, and I5 B→C.
Part a
Draw the node schematic and write two independent junction equations and three independent loop equations. Explain why the left pair and right pair cannot be treated as simple series groups before solving.
At B: I1 = I2 + I5. At C: I3 + I5 = I4. Source-left loop: 12 − 2I1 − 4I2 = 0. Source-right: 12 − 4I3 − 2I4 = 0. Top bridge loop A→B→C→A: −2I1 − 4I5 + 4I3 = 0.
Why this step? Two independent charge constraints and three independent physical path constraints match the five branch unknowns.
The bridge gives an alternative path at both B and C, so charge through R1 need not all pass through R2, and charge through R3 need not all pass through R4.
Why this step? Series reduction requires no alternative path at the common node.
Answer and check
Use the two stated junctions and three stated loops; the bridge prevents simple pairwise series reduction.
Part b
Solve the branch currents and node potentials VB and VC. Verify one unused loop and the source-power balance.
Use currents from voltage drops: (12 − VB)/2 = VB/4 + (VB − VC)/4, and (12 − VC)/4 + (VB − VC)/4 = VC/2. Simplify to 4VB − VC = 24 and −VB + 4VC = 12.
Why this step? These equations are the junction relations with the resistor’s own node-voltage differences inserted.
VB = 7.2 V and VC = 4.8 V give I1 = 2.4 A, I2 = 1.8 A, I3 = 1.8 A, I4 = 2.4 A, and I5 = 0.60 A.
Why this step? Each current is its signed node drop divided by its branch resistance.
Unused lower loop B→D→C→B gives −4I2 + 2I4 + 4I5 = −7.2 + 4.8 + 2.4 = 0. Source current is I1 + I3 = 4.2 A, so supplied power 50.4 W. Resistor powers are 11.52 + 12.96 + 12.96 + 11.52 + 1.44 = 50.4 W.
Why this step? An unused loop and power sum independently test the network solution.
Answer and check
VB = 7.2 V, VC = 4.8 V; currents (I1, I2, I3, I4, I5) = (2.4, 1.8, 1.8, 2.4, 0.60) A. Power totals 50.4 W.
Part c
Where would ideal meters measure bridge current and VB − VC? Describe qualitatively how a finite-resistance voltmeter across B–C could disturb the bridge.
Draw the two meter connections on the bridge schematic.
Insert an ideal ammeter in series with R5; connect an ideal voltmeter across B and C. Their ideal resistances are zero and infinite respectively.
Why this step? The meters measure the bridge branch rate and its endpoint potential difference.
A nonideal voltmeter adds another B–C current path and changes the network, so the measured potential difference and branch currents can shift. No numerical meter-loading solution is required.
Why this step? A finite meter resistance alters the topology and effective connection.
Answer and check
A in the bridge branch; V across B–C. A finite-resistance voltmeter loads that connection.
Scoring and feedback
- This is a one-source bridge, not unequal batteries in parallel. Require actual branch paths, independent equations, and conservation checks.
- a (4 points): one for bridge topology and no-series explanation, one for both junctions, two for the three independent loops.
- b (4 points): one for node equations, one for potentials/currents, one for unused-loop check, one for power balance.
- c (2 points): one for correct ideal meter placement, one for qualitative finite-resistance loading.
- c: the representation point requires an ammeter inserted in the R5 path and a voltmeter connected to B and C on the created bridge diagram.
Problem 19
A 12 V ideal source feeds R1 = 2.0 kΩ from source-positive node A to node B. Between B and source-negative node D there are parallel R2 = 4.0 kΩ and C = 100 μF branches. The capacitor starts uncharged. Later a switch disconnects R1 and the source, leaving C to discharge only through R2.
Part a
For the initial charging instant and long-time charging state, find VB, currents through R1 and R2 and C, final capacitor charge, and final energy. Explain why long-time capacitor voltage is not 12 V.
Draw the initial wire-equivalent and long-time open-branch equivalent schematics, keeping R2 connected in both.
Initially C has zero voltage, so B is at D’s 0 V. I1 = 12/2000 = 6.0 mA, I2 = 0, and IC = 6.0 mA.
Why this step? The initially uncharged capacitor branch temporarily acts as a zero-voltage connection.
At long time IC = 0. R1 and R2 form the remaining series loop, so I1 = I2 = 12/6000 = 2.0 mA. VB = I2R2 = 8.0 V.
Why this step? An open capacitor branch leaves the resistive path conducting; the node voltage follows its divider.
Qf = C(8.0) = 800 μC and Uf = ½(100 × 10⁻⁶)(8)² = 3.2 mJ. The feed resistor’s 4 V drop prevents the capacitor from reaching full battery voltage.
Why this step? Final capacitor voltage is its actual endpoint difference, not automatically source emf.
Answer and check
Initial: VB = 0, (I1, I2, IC) = (6, 0, 6) mA. Long-time: VB = 8 V, currents (2, 2, 0) mA; Q = 800 μC; U = 3.2 mJ.
Part b
After disconnecting the source and R1, find the discharge time constant and initial current magnitude through R2. Sketch VC and current magnitude during discharge. State initial stored energy and the total energy eventually converted in R2.
The only discharge path is R2, so τ = (4000)(100 × 10⁻⁶) = 0.40 s. Initial voltage remains 8 V, giving |I2,0| = 8/4000 = 2.0 mA.
Why this step? Switch topology determines the relevant resistance and preserves the initial capacitor voltage.
Both voltage and current magnitudes fall with flattening curves toward zero; about 37% initial charge remains at one τ. The initial 3.2 mJ of stored energy eventually converts to resistor heating.
Why this step? Source-free discharge removes the capacitor’s stored-energy configuration while conserving total energy.
Answer and check
Discharge τ = 0.40 s and initial |I2| = 2.0 mA; endpoints are zero; total heat in R2 is 3.2 mJ.
Part c
Plan a hands-on check of the discharge time constant without exponential fitting. Name measured variables, controls, repetitions, and sampling uncertainty. A sample trial gives (t in s, VC in V): (0,8.0), (0.20,4.9), (0.30,3.8), (0.40,3.0), (0.50,2.3), (0.60,1.8), (0.80,1.1). Each voltage has uncertainty ±0.1 V and each sample time ±0.02 s. Create a quantitative plot of VC/VC,0 versus time with scales and uncertainty; read an approximate τ from the 37% landmark and explain its precision.
Use a low-voltage supply, known R2 and rated C, switch, and high-resistance voltage sensor. Charge to a known initial voltage, switch to R2-only discharge, and record VC versus elapsed time. Read the time when voltage reaches about 37% of its initial value.
Why this step? At fixed C, voltage and charge have the same fractional discharge landmark.
Control C, initial voltage, meter placement, and resistor temperature. Repeat switching trials; report a time range bracketed by adjacent samples crossing the landmark, adding switch-timing uncertainty and component tolerances. Repeat with doubled R2 to test a doubled landmark time.
Why this step? Controls isolate the resistance change and the sampling interval limits meaningful timing precision.
For each trial, plot the measured voltage divided by its initial value against elapsed seconds. Give both axes scales, show time-sampling and voltage uncertainty, and locate the crossing of 0.37. Read the time interval consistent with the nearby readings rather than claiming precision finer than the sampling. Compare repeated crossing times with τ = R2C = 0.40 s.
Why this step? A quantitative measurement plot is distinct from assuming a mathematical transient fit. In a fixed capacitor, the charge fraction equals the voltage fraction.
The plotted fractions are 1.000, 0.613, 0.475, 0.375, 0.288, 0.225 and 0.138. The 0.40 s point is consistent with 0.37 within the voltage uncertainty. Report τ ≈ 0.4 s, with the crossing bracketed by 0.30–0.50 s readings, rather than asserting a fitted three-decimal time.
Why this step? The 37% landmark can be read from real sampled data. Sampling intervals and voltage uncertainty set the precision, even though the theoretical time constant is known.
Answer and check
A repeated low-voltage discharge measurement using the 37% landmark can test τ = R2C with stated timing and component uncertainty.
The supplied trial gives τ ≈ 0.4 s, consistent with 0.40 s calculated from R2C. Repeated data and sampling uncertainty set the reported precision.
Scoring and feedback
- Score branch-specific initial/final models. No arbitrary-time exponential or logarithmic calculation is needed.
- a (4 points): one for initial node voltage and all three currents; one for long-time resistive currents and node voltage; one for final capacitor charge and energy; one for both created endpoint schematics with R2 retained, consistent I1/I2/IC labels, and the explanation of why final capacitor voltage is 8 V rather than 12 V.
- b (3 points): one for discharge τ and initial current; one for created qualitative zero-endpoint voltage/current curves; one for initial stored energy and equal eventual resistor heat.
- c (3 points): one for the created quantitative measured voltage-fraction plot with scales, data and 0.37 landmark read; one for a coherent hands-on procedure with measured variables, controls and repetitions; one for sampling/voltage uncertainty and a justified precision or crossing interval.
Explain and apply: worked solutions
Compare the physical setup and the reasoning, as well as the final answer. Give credit for equivalent correct reasoning, using the rubric to find your next step.
What starts the net current?
A metal resistor is connected into a closed loop with a maintained battery potential difference. Its temperature and resistance are approximately fixed.
Part a
Which explanation connects the source to charge motion correctly?
The voltage supports an electric field in the resistive path; the field gives existing carriers average drift, while random motion continues.
- A maintained potential difference supports a field that exerts forces on existing carriers. The resulting drift adds a net crossing rate to ongoing random motion.
Scoring criteria
- Credit only the choice whose complete explanation satisfies the stated conditions.
Return to the unit problem →Try this problem in its lesson →
Can two equal wires resist differently?
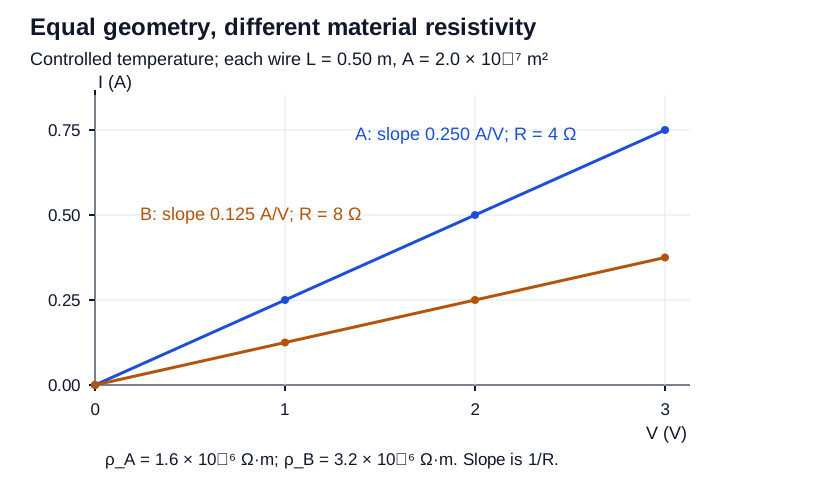
At a common controlled temperature, uniform wires A and B each have L = 0.50 m and cross-sectional area 2.0 × 10⁻⁷ m². Data are A: (V,I) = (0,0), (1.0,0.25), (2.0,0.50), (3.0,0.75), with V in volts and I in amperes. B has (0,0), (1.0,0.125), (2.0,0.250), (3.0,0.375). Both are approximately ohmic over this tested range.
Part a
Construct both quantitative I-versus-V graphs on common axes, find their slopes and resistances, and infer both resistivities. Explain what higher resistivity says about opposition to charge motion and how atomic/molecular structure can cause a difference at equal geometry. State what the graph cannot uniquely tell you microscopically.
Slopes: 0.250 and 0.125 A/V; R_A = 4.0 Ω, R_B = 8.0 Ω; ρ_A = 1.6 × 10⁻⁶ Ω·m, ρ_B = 3.2 × 10⁻⁶ Ω·m. Higher ρ represents stronger opposition to charge motion; differences in atomic/molecular structure and carrier interactions can produce it. The graph does not uniquely identify that structure.
- Plot each provided data set with voltage horizontally and current vertically, units, numeric scales and a line through zero.
- R = 1/slope, giving 4.0 and 8.0 Ω. Then ρ = RA/L: 4.0 × 2.0 × 10⁻⁷/0.50 = 1.6 × 10⁻⁶ Ω·m and twice that for B.
- Resistivity is intrinsic at a given material state and quantifies opposition to carrier motion; structure, arrangement and interactions affect that response. Equal dimensions remove geometry as the explanation for these different inferred coefficients.
- Many microscopic mechanisms can give an observed coefficient; macroscopic I–V data alone do not determine a unique atomic arrangement.
Scoring criteria
- 1 point: both actual quantitative graphs with plotted data and units.
- 1 point: both slopes and reciprocal resistances.
- 1 point: both inferred resistivities with Ω·m.
- 1 point: intrinsic opposition linked explicitly to atomic/molecular structure.
- 1 point: equal-geometry reasoning and honest microscopic inference limit.
Part b
A third wire uses material A at the same temperature but has twice the length and twice the area. Predict its R and ρ, and explain why changing the object’s dimensions does not force a change in the material coefficient.
R = 4.0 Ω; ρ remains 1.6 × 10⁻⁶ Ω·m. Length and parallel cross-section factors cancel in R, while local material structure/state is unchanged.
- R′/R_A = (L′/L)(A/A′) = 2/2 = 1.
- Changing sample geometry affects path length and number of parallel paths but not its stipulated composition/atomic arrangement or temperature.
Scoring criteria
- 1 point: unchanged numerical R and ρ.
- 1 point: causal path/parallel-area distinction from material structure.
Part c
The actual A wire is then heated while geometry changes negligibly. Predict the typical metallic trend of ρ, R and the I-versus-V slope. Contrast it explicitly with the stated temperature-independent ideal ohmic model, and explain whether one linear I–V graph at fixed temperature proves that idealization across temperatures.
Typical real-metal ρ and R increase, so I-versus-V slope 1/R decreases. A stated ideal fixed-ρ model keeps them unchanged. Linearity at one fixed temperature does not prove temperature independence across temperatures.
- At fixed geometry, R follows ρ. Typical real metal heating raises ρ and lowers its conductance slope.
- The ideal model separately assumes temperature-independent ρ; it can be used as a calculation approximation but is not established by the word ohmic alone.
- A line at one temperature tests proportionality in that range, not a comparison across temperatures.
Scoring criteria
- 1 point: typical real ρ/R increase and slope decrease.
- 1 point: clear separate ideal model and limited inference from one-temperature data.
Inspect diagram labels
The diagram keeps its full size here. Focus the view and use the arrow keys, or scroll across it, to inspect every label.
Return to the unit problem →Try this problem in its lesson →
What does ideal mean in the circuit model?
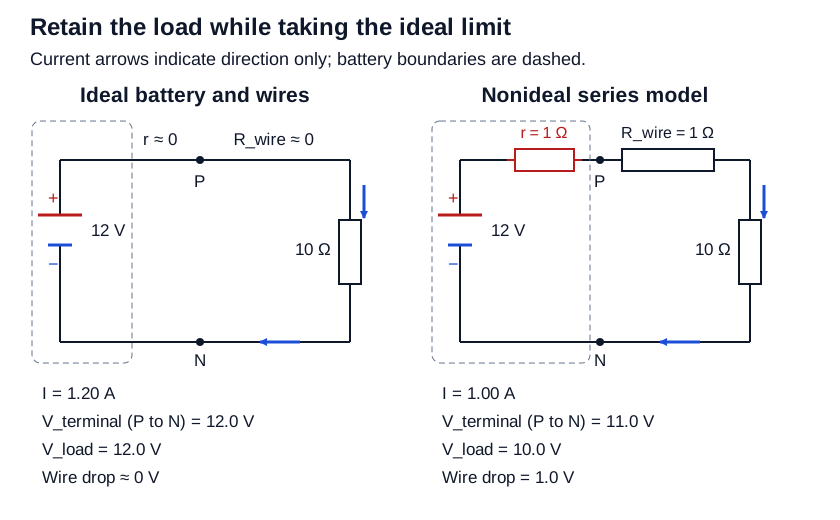
A battery of emf 12.0 V supplies a 10.0 Ω load through an unbranched loop. First use an ideal battery and ideal wires. Then compare a discharging nonideal battery with r = 1.0 Ω and total series wire resistance R_wire = 1.0 Ω. Load resistance remains constant. All stated voltage measurements are by ideal voltmeters.
Part a
State the resistance assumptions for both an ideal battery and ideal wires. Draw the ideal circuit and calculate current, terminal voltage, load voltage and wire voltage drop. Explain how finite current is compatible with zero ideal-wire voltage drop.
Ideal battery internal r ≈ 0; ideal-wire R_wire ≈ 0. I = 1.20 A, V_terminal = V_load = 12.0 V, wire drop ≈ 0. Current is limited by the 10.0 Ω load; a negligible wire drop is the ideal conducting-node approximation.
- Retain the finite load while omitting negligible internal and wire resistances.
- I = 12.0/10.0 = 1.20 A. No internal voltage loss gives 12.0 V terminal voltage; no wire loss gives the same load voltage.
- Draw one loop with correct source polarity and current direction. An ideal wire imposes equal node potentials; it does not require zero current.
Scoring criteria
- 1 point: both explicit ideal resistance assumptions.
- 1 point: actual ideal circuit with finite load and current direction.
- 1 point: current and all voltage values.
- 1 point: compatible finite-current/equal-potential wire explanation.
Part b
Draw the nonideal series model with the internal resistor inside the battery boundary and identify the two terminal-measurement nodes and the two load-measurement nodes. Find current and both measured voltages. Write a closed-loop voltage check and verify source power equals the sum of all three resistive powers.
I = 1.00 A; terminal voltage 11.0 V, load voltage 10.0 V. Loop: +12.0 − 1.0 − 1.0 − 10.0 = 0 V. Source power 12.0 W = 1.0 W internal + 1.0 W wire + 10.0 W load.
- Total series resistance is 10.0 + 1.0 + 1.0 = 12.0 Ω, so I = 1.00 A.
- V_terminal = ε − Ir = 11.0 V. The load-only voltage is IR_load = 10.0 V, leaving 1.0 V on the wires.
- Label external battery terminals P,N; the terminal voltage spans the entire external load-plus-wire path. The load-only meter spans the resistor ends.
- Power check: εI = 12.0 W and I²r + I²R_wire + I²R_load = 1 + 1 + 10 = 12 W.
Scoring criteria
- 1 point: actual series model, internal boundary and distinct meter nodes.
- 1 point: current, terminal and load voltages.
- 1 point: valid signed loop check.
- 1 point: complete power balance.
Part c
In another trial keep the 10.0 Ω load but reduce r and total wire resistance to 0.010 Ω each. Calculate the fractional current overestimate from using the ideal model, relative to the true nonideal current. Then explain why the same neglect argument fails if the finite load is removed and the battery is connected directly across its wires.
True I = 12.0/10.020 = 1.1976 A. Ideal I = 1.2000 A, an overestimate of 0.00200 = 0.200% relative to true I. Without the load, r and R_wire provide the current limit; an all-ideal direct-source short has no finite steady solution.
- Compute fractional error (I_ideal − I_true)/I_true = [(ε/10)/(ε/10.020)] − 1 = 10.020/10 − 1 = 0.00200.
- The omitted 0.020 Ω is small relative to the retained 10 Ω, explaining the small current error.
- If the load is removed, those resistances are the remaining limits and cannot be neglected by comparison with a finite load. An ideal source requires 12 V while an ideal short requires zero between the same nodes.
Scoring criteria
- 1 point: 1.1976 A and correctly referenced 0.200% error.
- 1 point: comparative resistance criterion and failed all-ideal short diagnosis.
Inspect diagram labels
The diagram keeps its full size here. Focus the view and use the arrow keys, or scroll across it, to inspect every label.
Return to the unit problem →Try this problem in its lesson →