Chapter 7 Solutions
Worked solutions to all thirty problems, with the reason for each step. These explanations were added for this edition; the chapter answer key and original worked examples follow below.
Chapter problems → · Chapter answer key → · Original worked examples →
Problem 1
Original problem · added worked solution
Authored worked explanation for the original source problem.
The width is (2−0)/2=1 and the left sample inputs are 0 and 1.
Why: A left sum omits the rightmost endpoint.
.
Why: Add width times height for each rectangle.
Reviewed answer: square unit.
Takeaway: Choose the samples before evaluating heights.
Final answer
Problem 2
Original problem · added worked solution
Authored worked explanation for the original source problem.
Width is 1; right sample inputs are 2, 3, and 4.
Why: Three equal subintervals cover [1,4].
.
Why: Multiply the sum of right-endpoint heights by the common width.
Reviewed answer: square units.
Takeaway: The source's 5.15 is the result rounded to two decimals.
Final answer
Problem 3
Original problem · added worked solution
Authored worked explanation for the original source problem.
Width is π/2, and midpoints are π/4, 3π/4, 5π/4, and 7π/4.
Why: Sample halfway inside each quarter of the interval.
The four cosine values cancel in opposite pairs, leaving four heights' constant parts totaling 8.
Why: The symmetry avoids separate decimal evaluations.
.
Why: Use the interval width after summing heights.
Reviewed answer: square units.
Takeaway: Periodic symmetry can simplify a numerical rule exactly.
Final answer
Problem 4
Original problem · added worked solution
Authored worked explanation for the original source problem.
Width is 2; sampled heights at −2, 0, 2 are 16, 0, 16.
Why: Two trapezoids need three boundary heights.
.
Why: The two endpoint heights receive half weight.
Reviewed answer: square units.
Takeaway: Interior boundaries are counted by both neighboring trapezoids.
Final answer
Problem 5
Original problem · added worked solution
Authored worked explanation for the original source problem.
On [0,1], √x is above x²; use their difference as the rectangle height.
Why: An area between curves uses upper minus lower.
With width 1/4, left inputs 0, 1/4, 1/2, 3/4 give .
Why: Each rectangle samples the gap, not just the upper curve.
This is about 0.299533, which rounds to the source's 0.3.
Why: Keep precision until the completed sum.
Reviewed answer: square units.
Takeaway: Build the gap function before applying the numerical rule.
Final answer
Problem 6
Original problem · added worked solution
Authored worked explanation for the original source problem.
Source review note: The source gives 3.25; the four-trapezoid calculation for the printed curves gives 3.2395055…, rounding to 3.24.
Let ; g≥0 on [1,3].
Why: The exponential curve lies above the logarithmic curve on this interval.
With width 1/2, use heights at 1, 1.5, 2, 2.5, 3 and compute .
Why: Half-weight the endpoints and fully weight the three interior heights.
The numerical result is about 3.2395055, or 3.24 to two decimal places.
Why: Use the printed functions and interval without changing the source record.
Reviewed answer: square units.
Takeaway: Accurate table heights matter as much as choosing the right rule.
Final answer
Problem 7
Original problem · clarified · added worked solution
Clarification: Estimate geometric area between the curve and the x-axis, using the absolute value of each right-endpoint height.
Authored worked explanation for the original source problem.
Source review note: The source gives 2.656. Neither the printed eight-rectangle right signed sum (0.8125) nor its absolute-height geometric sum (2.46875) equals that value.
Width is 1/4, with right sample inputs k/4 for k=1,…,8.
Why: The curve crosses the axis at √2, so some sampled heights are negative.
The signed sum is .
Why: Adding negative heights estimates net signed area.
For geometric area, use the absolute heights; the last three heights are −1/4, −17/16, and −2. Flipping them adds , giving 79/32.
Why: Geometric area cannot subtract below-axis regions.
Reviewed answer: Right signed sum ; right geometric-area sum .
Takeaway: State whether the requested area is signed or geometric when the curve crosses the axis.
Final answer
Problem 8
Original problem · added worked solution
Authored worked explanation for the original source problem.
Source review note: The source gives 1.27. The specified four midpoint rectangles yield exactly 75/64=1.171875.
The gap is on [0,1], with width 1/4.
Why: The line is above the parabola throughout the interval.
Midpoints 1/8, 3/8, 5/8, 7/8 have gap heights 119/64, 95/64, 63/64, 23/64.
Why: Evaluate both curves at the same midpoint.
Multiply their sum by 1/4 to obtain 300/256=75/64.
Why: Every rectangle has the common width.
Reviewed answer: square units.
Takeaway: Gap estimates need a midpoint in both functions.
Final answer
Problem 9
Original problem · added worked solution
Authored worked explanation for the original source problem.
Unit widths and right inputs 1,2,… produce .
Why: The interval starts at zero, so the first right sample is 1.
The sum through N rectangles is .
Why: Multiply the finite geometric sum by 1/2 and subtract to verify the formula.
As N grows, the leftover 2^(−N) tends to 0, giving 1.
Why: This is the limit of these fixed-width rectangles, not the exact area under the curve.
Reviewed answer: square unit as a rectangle-sum estimate.
Takeaway: An infinite count of fixed-width rectangles can still underestimate the exact area.
Final answer
Problem 10
Original problem · clarified · added worked solution
Clarification: Estimate the unit-width right-rectangle sum, whose sample points are 1,2,3,… . This is a sampled estimate; the exact improper area starting at x=0 diverges.
Authored worked explanation for the original source problem.
Source review note: The source gives 1.6, a coarse right-sum estimate. The fixed-width infinite sum is about 1.6449; the improper integral from 0 is divergent, so the sum must not be presented as that exact area.
Right samples give .
Why: The infinite height at x=0 is not a right sample, so the rectangle sum itself can be finite.
For k>N, ; the two comparison tails telescope to 1/(N+1) and 1/N.
Why: A telescoping comparison bounds the unknown tail without using integration from the next chapter.
For N=100, S_N≈1.6349839, so .
Why: Adding the tail bounds gives a controlled numerical estimate near 1.6449.
The actual curve is unbounded at zero, so this sampled estimate alone cannot establish a finite geometric area there.
Why: A numerical sampling scheme can miss a singular endpoint.
Reviewed answer: The unit-width right sum is about 1.6449; it does not represent a finite exact area from zero.
Takeaway: A finite sampled sum does not settle the behavior of the original area at a singular endpoint.
Final answer
Problem 11
Added problem and worked solution
Estimate the area under on using three left rectangles.
Authored solution to an added practice problem.
Width is 1; left samples for [1,4] with n=3 are 1,2,3.
Why: Left sampling starts at the interval's initial endpoint.
.
Why: The function height equals its input.
Reviewed answer: square units.
Takeaway: Indexing distinguishes a left sum from a right sum.
Final answer
Problem 12
Added problem and worked solution
For on [0,3], use three right rectangles, compute the matching left sum, and give area bounds.
Authored solution to an added practice problem.
For f=2^(−x) on [0,3], width is 1 and the right heights are 1/2,1/4,1/8.
Why: The right sum uses inputs 1,2,3.
R₃=7/8; the left heights 1,1/2,1/4 give L₃=7/4.
Why: The same partition selects the opposite endpoints.
Since the function is nonnegative and decreasing, the right sum underestimates and the left sum overestimates.
Why: Every slice's heights lie between its endpoint heights.
Reviewed answer: , ; the area lies between them.
Takeaway: Use monotonicity to turn endpoint sums into bounds.
Final answer
Problem 13
Added problem and worked solution
Use two midpoint rectangles to estimate the area under on [−1,1].
Authored solution to an added practice problem.
On [−1,1] with n=2, width is 1 and the midpoints are −1/2 and 1/2.
Why: Midpoints are centered within the two intervals.
Each height is , so M₂=5/2.
Why: The even quadratic has matching heights at opposite samples.
Reviewed answer: square units.
Takeaway: Symmetry can simplify a midpoint sum.
Final answer
Problem 14
Added problem and worked solution
Use three trapezoids for on [−1,2]. Explain why the result is exact.
Authored solution to an added practice problem.
For f=2x+3 on [−1,2], three trapezoids have width 1 and boundary heights 1,3,5,7.
Why: The vertical shift keeps all heights positive.
T₃=1(1/2+3+5+7/2)=12.
Why: Endpoints have half weight.
A line's graph is the exact sloping top of each trapezoid.
Why: No curved gap remains above or below those tops.
Reviewed answer: square units, exactly.
Takeaway: Trapezoids exactly fill a region under a linear function.
Final answer
Problem 15
Added problem and worked solution
For a decreasing nonnegative function, explain which equal-width rectangle estimate is larger than the true area: left or right?
Authored solution to an added practice problem.
On each subinterval of a decreasing nonnegative graph, the left height is the largest and the right height the smallest.
Why: Every other height lies between those boundary values.
Each left rectangle contains that slice's region, while each right rectangle fits inside it.
Why: Adding the slice comparisons preserves the inequality.
Reviewed answer: Left is an overestimate and right an underestimate.
Takeaway: Monotonicity determines the direction of endpoint-sampling error.
Final answer
Problem 16
Added problem and worked solution
At x=0,1,2,3 a table gives f=2,4,8,10. Assume f is nonnegative and increasing. Find left/right sums and area bounds on [0,3].
Authored solution to an added practice problem.
The width is 1. Left heights are 2,4,8; right heights are 4,8,10.
Why: Use the table's ordered boundary values.
The sums are 14 and 22, and monotonic increase makes them lower and upper bounds.
Why: The added monotonicity assumption bounds unsampled heights.
Reviewed answer: , , and geometric area lies between 14 and 22.
Takeaway: A table needs a shape assumption to turn samples into guaranteed bounds.
Final answer
Problem 17
Added problem and worked solution
A table gives (x,f(x))=(0,2),(1,4),(3,8). Estimate its area with a trapezoid on each interval.
Authored solution to an added practice problem.
On [0,1], the trapezoid contributes .
Why: Its width is 1.
On [1,3], it contributes , so the total is 15.
Why: Use each interval's own width rather than a single uniform Δx.
Reviewed answer: square units.
Takeaway: Nonuniform data require local widths.
Final answer
Problem 18
Added problem and worked solution
Use two midpoint rectangles for the area between and on [0,1].
Authored solution to an added practice problem.
The upper curve is y=3 and the lower is y=x², so the gap is 3−x² on [0,1].
Why: Use a common input for both boundary curves.
With two rectangles, width 1/2 and midpoints 1/4,3/4, the gap heights are 47/16 and 39/16.
Why: The samples stay halfway inside each interval.
The estimate is .
Why: Multiply by width only after adding both gap heights.
Reviewed answer: square units.
Takeaway: Build the gap before sampling it.
Final answer
Problem 19
Added problem and worked solution
A function is nonnegative and concave up on an interval. Explain whether its trapezoidal estimate lies above or below the exact area.
Authored solution to an added practice problem.
For a concave-up graph, each chord lies above or on the graph.
Why: The slope increases, so the graph bends below its joining secant line.
Each trapezoid fills up to the chord and therefore contains the curve's slice.
Why: Sum the slice inequalities across the interval.
Reviewed answer: The trapezoidal estimate is an overestimate.
Takeaway: Concavity predicts a trapezoid error's sign.
Final answer
Problem 20
Added problem and worked solution
Use two midpoint rectangles for on [0,2]. Explain the error direction using concavity.
Authored solution to an added practice problem.
For on [0,2], the graph is concave down.
Why: Its second derivative is −2.
With two rectangles, width 1 and midpoints 1/2,3/2 give .
Why: The midpoint samples sit high relative to each interval's average height.
The tangent-line symmetry around each midpoint bounds the curve below those midpoint rectangles in total.
Why: A concave-down curve lies below its midpoint tangent, whose odd linear change cancels over a symmetric interval.
Reviewed answer: square units; an overestimate for this concave-down graph.
Takeaway: Concavity can determine the error direction without evaluating an integral.
Final answer
Problem 21
Added problem and worked solution
At x=0,1,2,3 a table gives f=0,−2,1,1. On [0,3], find the signed right sum and the right estimate of geometric area.
Authored solution to an added practice problem.
Width is 1 and the right heights are −2,1,1, giving −2+1+1=0.
Why: Negative height contributes negatively to net signed area.
For a geometric-area estimate use 2,1,1, yielding 4.
Why: Replace sampled negative heights by their absolute values.
Reviewed answer: Signed right sum 0; absolute-height right sum 4.
Takeaway: Cancellation can hide a nonzero geometric region.
Final answer
Problem 22
Added problem and worked solution
Compare left sums with n=2 and n=4 for on [0,2]. Why does the second estimate increase?
Authored solution to an added practice problem.
For f=x³ on [0,2], n=2 gives width 1 and heights 0,1, so L₂=1.
Why: The function is increasing and nonnegative.
With n=4, width 1/2 and left heights 0,1/8,1,27/8 give L₄=9/4.
Why: Narrower left rectangles fill more of each increasing slice.
Reviewed answer: , ; both underestimate.
Takeaway: Refining this increasing function raises its lower estimate.
Final answer
Problem 23
Added problem and worked solution
For on [0,1], write Rₙ using and find its limit.
Authored solution to an added practice problem.
Width is 1/n, and the kth right height is k/n, giving .
Why: Separate the sample height from the rectangle width.
Use to get the formula, which tends to 1/2.
Why: The limiting rectangle sum gives the area as widths approach zero.
Reviewed answer: ; limiting area 1/2.
Takeaway: A finite arithmetic sum can describe every resolution at once.
Final answer
Problem 24
Added problem and worked solution
Compute left, right, midpoint, and trapezoidal estimates with n=2 for on [0,2].
Authored solution to an added practice problem.
For f=1/(1+x) on [0,2], width is 1. Boundary heights are 1,1/2,1/3, so L₂=3/2 and R₂=5/6.
Why: The decreasing shape makes the left sum larger.
Midpoint heights at 1/2 and 3/2 are 2/3 and 2/5, giving M₂=16/15.
Why: Midpoints differ from the boundary samples.
T₂=1/2+1/2+1/6=7/6.
Why: Half-weight endpoints and fully weight the interior boundary.
Reviewed answer: , , , .
Takeaway: The same partition compares sampling rules across a curved function.
Final answer
Problem 25
Added problem and worked solution
Find all antiderivatives of .
Authored solution to an added practice problem.
Increase the exponent in 6x² to 3 and divide its coefficient by 3, giving 2x³.
Why: Differentiating reverses the inverse power step.
The constant −4 has primitive −4x, and an arbitrary C contributes zero derivative.
Why: Every constant shift has the same derivative.
Reviewed answer: .
Takeaway: An antiderivative is a family until extra data fix its constant.
Final answer
Problem 26
Added problem and worked solution
Find an antiderivative of and check it.
Authored solution to an added practice problem.
Differentiating cos(3x) gives −3sin(3x).
Why: The inside derivative supplies a factor 3.
Multiply by −1/3 so the derivative becomes exactly sin(3x).
Why: Undo the chain multiplier rather than multiplying by it again.
Reviewed answer: .
Takeaway: Check a proposed primitive by differentiation.
Final answer
Problem 27
Added problem and worked solution
Find F if and .
Authored solution to an added practice problem.
All primitives of 2x are x²+C.
Why: The derivative of any constant is zero.
F(1)=6 gives 1+C=6, so C=5.
Why: The extra point selects one member of the family.
Reviewed answer: .
Takeaway: One initial value determines the additive constant.
Final answer
Problem 28
Added problem and worked solution
A student proposes as an antiderivative of . Check and correct it.
Authored solution to an added practice problem.
Differentiate (1/2)sin(2x): the chain factor 2 cancels the 1/2, leaving cos(2x).
Why: The derivative check exposes the missing coefficient.
For the stated integrand, sin(2x)+C differentiates to 2cos(2x).
Why: Match the entire integrand, not just its function type.
Reviewed answer: The proposed function differentiates to ; a primitive of 2cos(2x) is sin(2x)+C.
Takeaway: Differentiation is the quickest primitive check.
Final answer
Problem 29
Added problem and worked solution
A velocity table gives 2,6,14 m/s at t=0,1,2 s. Use trapezoids to estimate the displacement over the two seconds.
Authored solution to an added practice problem.
For times 0,1,2 seconds and velocities 2,6,14 m/s, each interval has width 1 s.
Why: Multiplying time by velocity gives displacement units.
m.
Why: Average neighboring velocities on each interval.
Reviewed answer: Estimated displacement 14 m.
Takeaway: Area estimates can estimate accumulated change, with units explaining why.
Final answer
Problem 30
Added problem and worked solution
For the infinite unit-width right rectangle sum of from zero, how many rectangles make its remaining tail less than 0.01?
Authored solution to an added practice problem.
For f=2^(−x) with unit-width right rectangles from zero, the sum through N is 1−2^(−N), so the remaining tail is 2^(−N).
Why: The same geometric ratio controls every leftover block.
Require ; N=6 gives 1/64>0.01, while N=7 gives 1/128<0.01.
Why: Check neighboring integers to find the first sufficient rectangle count.
Reviewed answer: After 7 right rectangles; the remaining tail is .
Takeaway: A known tail formula makes an approximation tolerance concrete.
Final answer
Chapter answer key and worked steps
Answers and worked steps for the original problems, including verified corrections where needed.
-
Original short answer
Problem 1 → -
Original short answer
Problem 2 → -
Original short answer
Problem 3 → -
Original short answer
Problem 4 → -
Original short answer
Problem 5 → -
Corrected answer
square units.Problem 6 → -
Corrected answer
square units.Problem 7 → -
Corrected answer
square units.Problem 8 → -
Original short answer
Problem 9 → -
Checked answer
The unit-width right sum is about 1.6449; it does not represent a finite exact area from zero.Problem 10 →
Source worked examples
These are the book’s example problems and worked steps, with the original explanations.
Example Problem 7.1.1
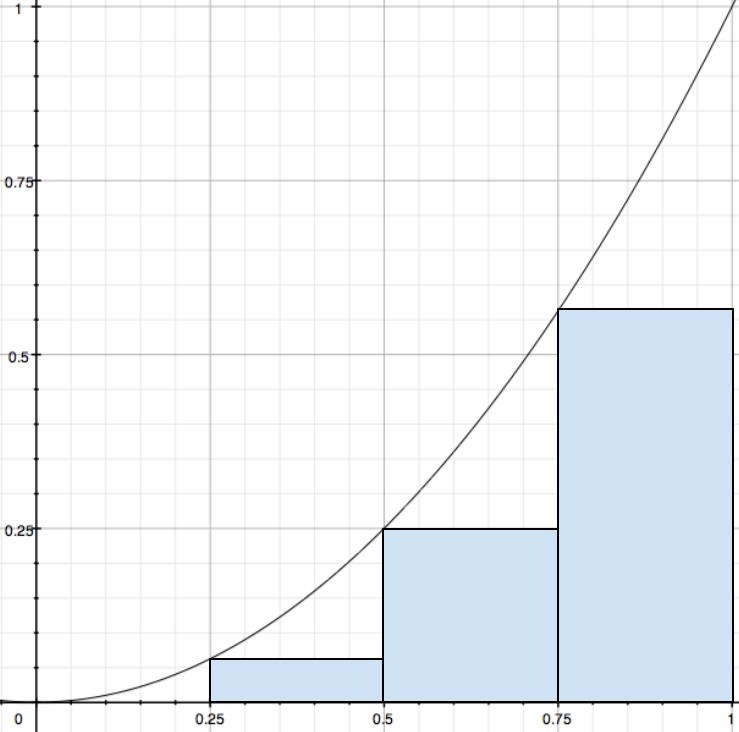
Find the area under the function from x = 0 to x = 1 using 4 rectangles and the left corner point approximation method.
Interactive 7.1.1 Example Problem 7.1.1
Read all original figure notes
Left corner points
Large amount of white space
Example Problem 7.1.2
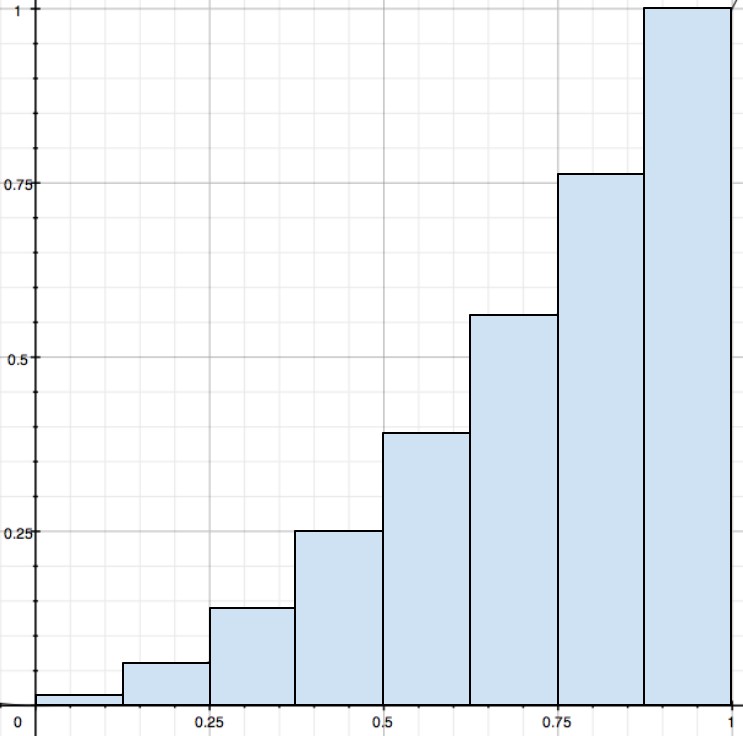
Find the area under the function from x = 0 to x = 1 using 8 rectangles and the right corner point approximation method.
Interactive 7.1.2 Example Problem 7.1.2
Read all original figure notes
More Rectangles
Same Base
Right corner points
Example Problem 7.2.1
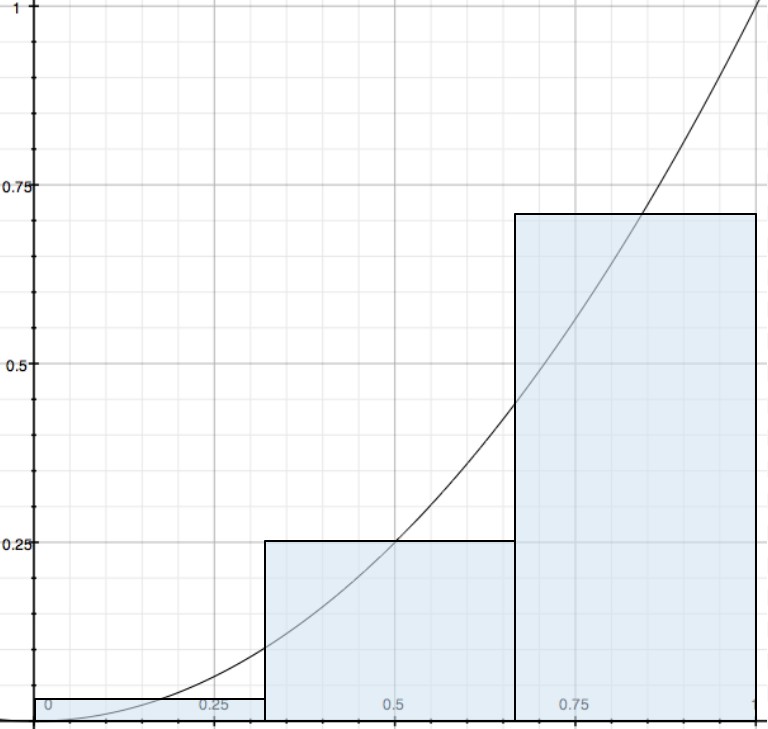
With the midpoint method, estimate the area under the curve of from x = 0 to x = 1 using 3 rectangles.
Interactive 7.2.1 Example Problem 7.2.1
Read all original figure notes
The Midpoint
What if we just used one rectangle?
Example Problem 7.2.2
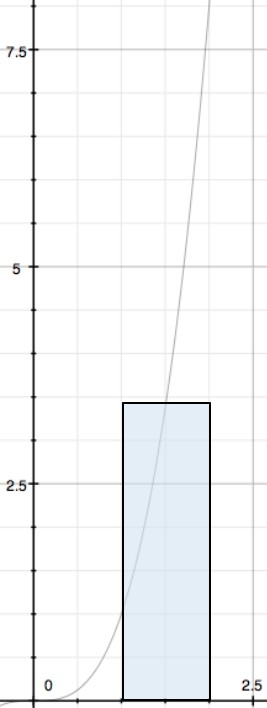
Find the area under the curve from x = 1 to x = 2 using the midpoint method and just one rectangle.
Interactive 7.2.2 Example 7.2.2
Read all original figure notes
Overestimated Area
Underestimated area
Example Problem 7.3.1
Using the trapezoidal method and n = 3, find the area under the curve from x = 0 to x = 1
Interactive 7.3.1 Example Problem 7.3.1
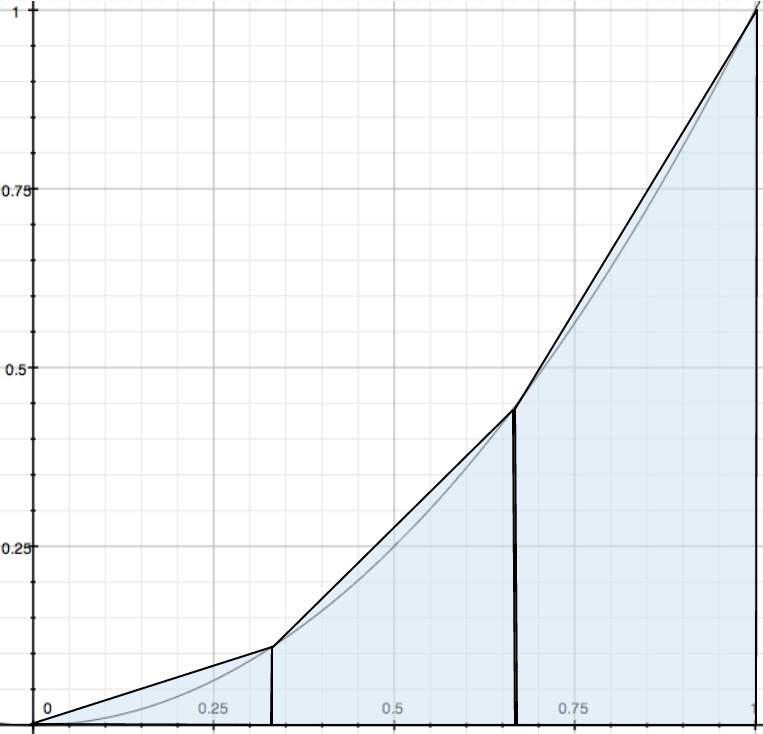
Read all original figure notes
Compare the actual errors
The height
The base
Example Problem 7.4.1
What is the anti-derivative of at , provided there is no constant in the original function?
Example Problem 7.4.2
What is the anti-derivative of ? Assume the constant term is equal to c.
Example Problem 7.4.3
What is the anti-derivative of ? Do not forget the constant term!
Example Problem 7.4.4
What is the anti-derivative of ?