Access this content offline
Omniguides
Skip to the reading

Rectangular Methods

This original textbook reading covers part of the AP topic. Follow the AP course outline for complete topic instruction and practice.

It’s as easy as length times width

We can estimate areas under curves by splitting up the curves into equal rectangles each with a base of (x2-x1) and height of f(x2) for right-point rectangles, or a height of f(x1) for left-point rectangles.

We can get better estimates by reducing the difference between the x-values, or in other words, making dx smaller. However, we have to do more calculations if we want that.

Example Problem 7.1.1

Find the area under the function f(x)=x2 from x = 0 to x = 1 using 4 rectangles and the left corner point approximation method.

We have 4 rectangles and the interval of interest is from x = 0 to x = 1. That means that each rectangle has a base of 1-04 , or 0.25. Since we are using left corner point approximation, the y-values where the rectangles touch the curve will be f(0), f(0.25), f(0.5), and f(0.75). These are our heights, so let’s add them up!

dddArea=(0.25)f(0)+(0.25)f(0.25)+(0.25)f(0.50)+(0.25)f(0.75)

Area=0+(0.25)(0.0625)dd+(0.25)(0.25)+(0.25)(0.5625)=0.21875

The real answer is 13 , so we are a little ways off. Since y=x2 is an increasing function, we underestimated it with the left-point method.

Example Problem 7.1.2

Find the area under the function f(x)=x2 from x = 0 to x = 1 using 8 rectangles and the right corner point approximation method.

Here, we have the same function, but using a different method of approximation, and a higher number of rectangles. We undershot the approximation the first time, so you can imagine that with the right corner point method, we will get an overestimated figure.

The interval is still 0 to 1, but this time we are working with 8 rectangles, so each rectangle’s base is 18 of a unit wide, or 0.125.

Since we are using the right corner point method this time, each rectangle’s height will start at the first value of dx, and end at 1. The sum of the areas of each of our rectangles would look like the following:

Area=(0.125)⋅[f(0.125)+f(0.25)dd+f(0.375)+f(0.5)+f(0.625)+f(0.75)+f(0.875)+f(1)]

What we did here is factor out 0.125 using the distributive property because it was a common multiplier among all the terms. Now we can just substitute the function values inside the parentheses.

Area=(0.125)⋅[(0.125)2+(0.25)2dddd+(0.375)2+(0.5)2+(0.625)2dd+(0.75)2+(0.875)2+(1)2]

=0.125⋅(3.1875)

=0.3984

As noted before, the exact area under that curve is 13. We are much more accurate than before, less than 25% off. As expected, this is an overestimate of the area rather than an underestimate that we got with the left corner point approximation method.

On the next page are visual pictures of the calculations we just performed. Perhaps they will help you understand the mathematics behind what we have just done.

Interactive 7.1.1 Example Problem 7.1.1
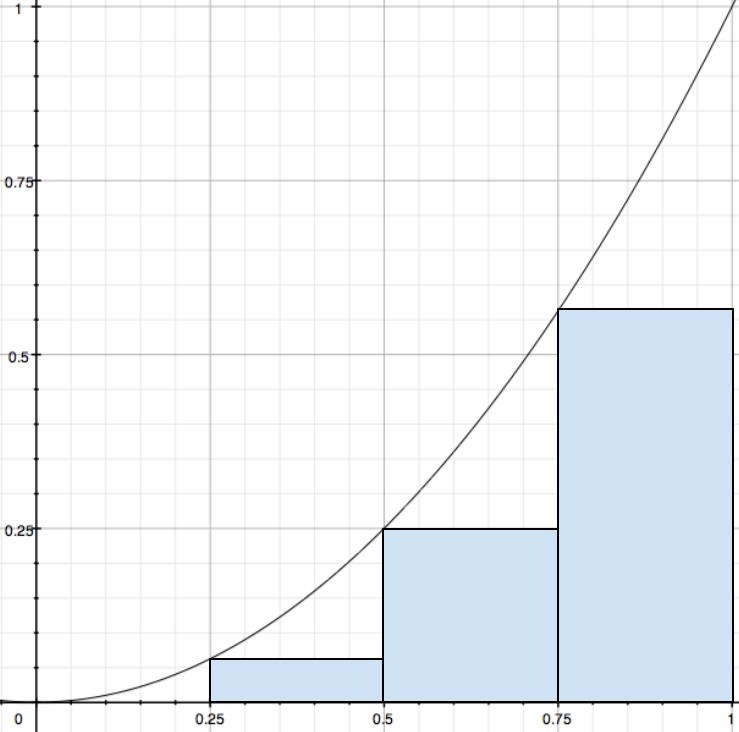
Interactive 7.1.1 Example Problem 7.1.1
Read all original figure notes

Left corner points

Our first rectangle had a height of 0, so it is not shown here, but notice that our rectangles all have the same base, and their heights are calculated such that their left corner point touches the graph.

Large amount of white space

The large amount of white space indicates the area under the graph that was not taken into account by our approximation method. Since the area is really large, our final value’s accuracy ended up being really low.

Interactive 7.1.2 Example Problem 7.1.2
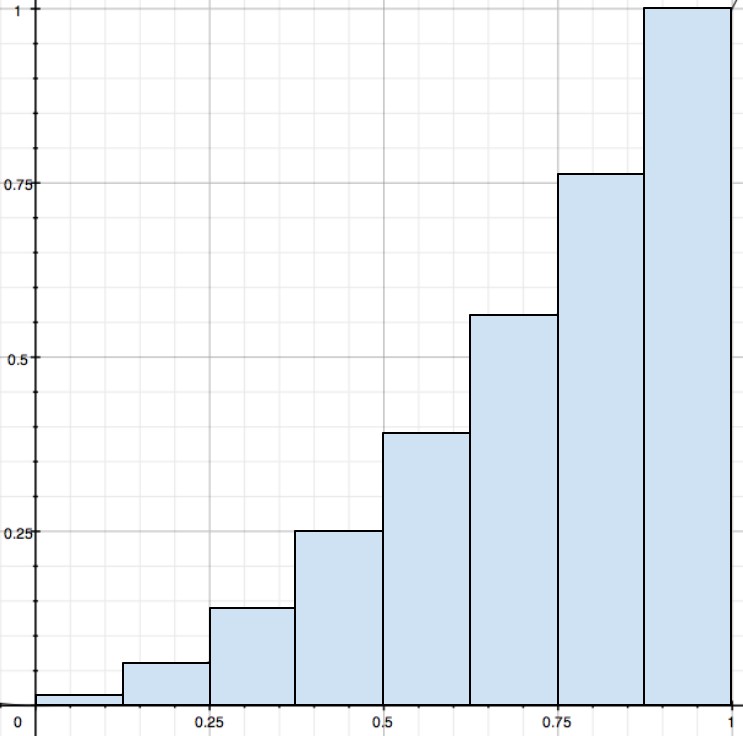
Interactive 7.1.2 Example Problem 7.1.2
Read all original figure notes

More Rectangles

For x² on [0,1], the exact integral is 1/3. Four right-endpoint rectangles give 15/32, with relative error 13/32 = 40.625%. Eight give 51/128, with relative error 25/128 = 19.53125%. Refining this same interval improves this example; the claim of more than 50% error with four rectangles was incorrect.

Same Base

Since the rectangles have the same base (width), we can factor out the 0.125 out of the calculation like we did, using the distributive property.

Right corner points

Although the graph seems invisible, the right corner points of each rectangle coincide with points on the graph.

Pop Quiz 7.1.1 Corner point estimation of areas under curves

Question 1 of 5 · 0 correct

Estimate the area of y=-x+1 from x=0 to x=1 using 2 rectangles and the left corner point approximation method. What is the estimated area? Is this an overestimate or an underestimate?

Select one answer.
Search lessons, terms and problems