3.1 Introduction to Probability
Section Overview
- Example 3.1.1
- Interactive 3.1.1 - Example 3.1.1
- Example 3.1.2
- Figure 3.1.1
- Example 3.1.3
- Gallery 3.1.1 - Example 3.1.3
- Pop Quiz 3.1.1
The Idea of Probability
A big fact emerges when we watch coin tosses or the results of random sampling and random assignment closely: chance behavior is unpredictable in the short run, but has a regular and predictable pattern in the long run. After many repetitions, the Law of Large Numbers states that we can call this long-run relative frequency of a chance outcome its probability. We will explore this further in Example 3.1.1.
Example 3.1.1 — recorded answer
Say when you first start tossing a coin that the proportion of heads start at 0 on the first toss (because it landed on tails), rises to 0.5 when the second toss gives a head, then falls to 0.33, 0.25, and 0.2 as we get more tails.
After that, say the proportion of heads begins to increase, rising well to 0.5 before it decreases again.
But suppose we keep tossing the coin until we have made 500 tosses. As we have seen, the proportion of tosses that produce heads is quite variable at first. As we make more and more tosses, however, the proportion of heads gets close to 0.5 and stays there.
Interactive 3.1.1 graphically displays this example problem if this concept isn’t quite
Interactive 3.1.1 Example 3.1.1
Earlier tosses — recorded annotation
Later tosses — recorded annotation
Myths about Short-Run Regularity
The idea of probability seems straightforward. It answers the question “What would happen if we did this many times?” In fact, both the behavior of random phenomena and the idea of probability are a bit subtle. In fact, our intuition about randomness tries to tell us that random phenomena should also be predictable in the short run. When they aren’t we look for some explanation other than chance variation.
Example 3.1.2 — recorded answer
At first glance, it would seem that HTHTT is more probable because it looks more “random”. However, both outcomes are equally likely. The coin has no memory and thus there is no “effort” put into trying to create a more random-looking sequence.
Simulation
Imitating chance behavior based on a model that precisely reflects the situation is called a simulation. Simulations are commonly carried about in the following ways:
- Physical devices such as cards, coin, or dice
- Technology such as a calculator’s random number generator
- A table of random digits such as Figure 3.1.1. A table of random digits usually starts at row 101 and usually ends at row 200. For our purposes, however, we’ve only included up to row 118.
All of these methods will be explained more clearly in Example 3.1.3
Figure 3.1.1
Source: Introduction to the Practice of Statistics, 6th Edition
| Row | Group 1 | Group 2 | Group 3 | Group 4 | Group 5 | Group 6 | Group 7 | Group 8 |
|---|---|---|---|---|---|---|---|---|
| 101 | 19223 | 94534 | 05756 | 28713 | 96409 | 12531 | 42544 | 82853 |
| 102 | 73676 | 47145 | 99400 | 01927 | 27754 | 42648 | 82425 | 36290 |
| 103 | 45467 | 71759 | 77558 | 00095 | 32863 | 29485 | 82226 | 90056 |
| 104 | 52711 | 38889 | 93074 | 60227 | 40011 | 85848 | 48767 | 52573 |
| 105 | 95592 | 94007 | 69971 | 91481 | 60779 | 53791 | 17297 | 59335 |
| 106 | 68417 | 35013 | 15529 | 72765 | 85089 | 57567 | 50211 | 47487 |
| 107 | 82739 | 57890 | 20807 | 47511 | 81676 | 55300 | 94383 | 14893 |
| 108 | 60940 | 72024 | 17868 | 24943 | 61790 | 90656 | 87964 | 18883 |
| 109 | 36009 | 19365 | 15412 | 39638 | 85453 | 46816 | 83485 | 41979 |
| 110 | 38448 | 48789 | 18338 | 24697 | 39364 | 42006 | 76688 | 08758 |
| 111 | 81486 | 69487 | 60513 | 09297 | 00412 | 71238 | 27649 | 39950 |
| 112 | 59636 | 88804 | 04634 | 71197 | 19352 | 73089 | 84898 | 45785 |
| 113 | 62568 | 75206 | 40325 | 03699 | 71080 | 22553 | 11486 | 11776 |
| 114 | 45149 | 32992 | 75730 | 66280 | 03819 | 56202 | 02938 | 75915 |
| 115 | 61041 | 77684 | 94322 | 24759 | 73698 | 14526 | 31893 | 32592 |
| 116 | 14459 | 26056 | 31424 | 80371 | 65103 | 62253 | 50490 | 61181 |
| 117 | 38167 | 98532 | 62183 | 75632 | 23417 | 26185 | 41448 | 75532 |
| 118 | 73190 | 32533 | 04475 | 29669 | 84407 | 90785 | 65956 | 86382 |
Example 3.1.3 — recorded answer
a) Out of the physical devices suggested earlier in the section, playing cards may seem to be the best option because there are enough cards to perform the simulation. We could use the ace up to 10 to represent all of the possibilities of the raffle, with 7, 8, 9, and 10 represent all of the possibilities of winning. Each of the five shoppers could be represented by five different decks. One complication with this approach is that since the cards would not be replaced, the probability of one shopper winning would affect the chances of the next shopper. Then there are face cards… since that gets complicated, we could also opt to use a 10-sided die as shown in Gallery 3.1.1, where rolling a 7, 8, 9, or 10 for one shopper wouldn’t affect the chances of the next shopper, and rolling the dice 5 consecutive times represents one repetition. This simulation method tells us that out of 100 repetitions, 10 result in at least 4 out of 5 shoppers winning a gift card, making the probability .
b) Slide 2 in Gallery 3.1.1 shows the randInt function randomly generating integers 1 through 10. This method works similarly to the 10-sided die because generating a 4 does not prevent the function from generating a 4 in the future.
c) For the random digits table, we will use lines 101 to 112 and part of 113 for a total of 100 repetitions. Each repetition has 5 random digits for the 5 consecutive shoppers. The condition for winning is if a shopper has the number 7, 8, 9, or 0. The results are shown in Gallery 3.1.1. The highlighted sections are the repetitions where at least 4 of the shoppers won a gift card. There are 12 repetitions highlighted out of 100, making the probability of 4 out of 5 shoppers winning a gift card . This is feasible because it is very close to the probability from rolling the 10-sided die in (a), and it took far less time. Yay, random digits tables!
Gallery 3.1.1 Example 3.1.3
Frame 1 of 3
Simulation using a physical device - more specifically a 10-sided die. Only the repetitions where at least 4 out of the 5 consecutive shoppers win a gift card are shown. This simulation method tells us that out of 100 repetitions, 10 result in at least 4 out of 5 shoppers winning a gift card, making the probability 10/100. Open full-size image S0209Frame 2 of 3
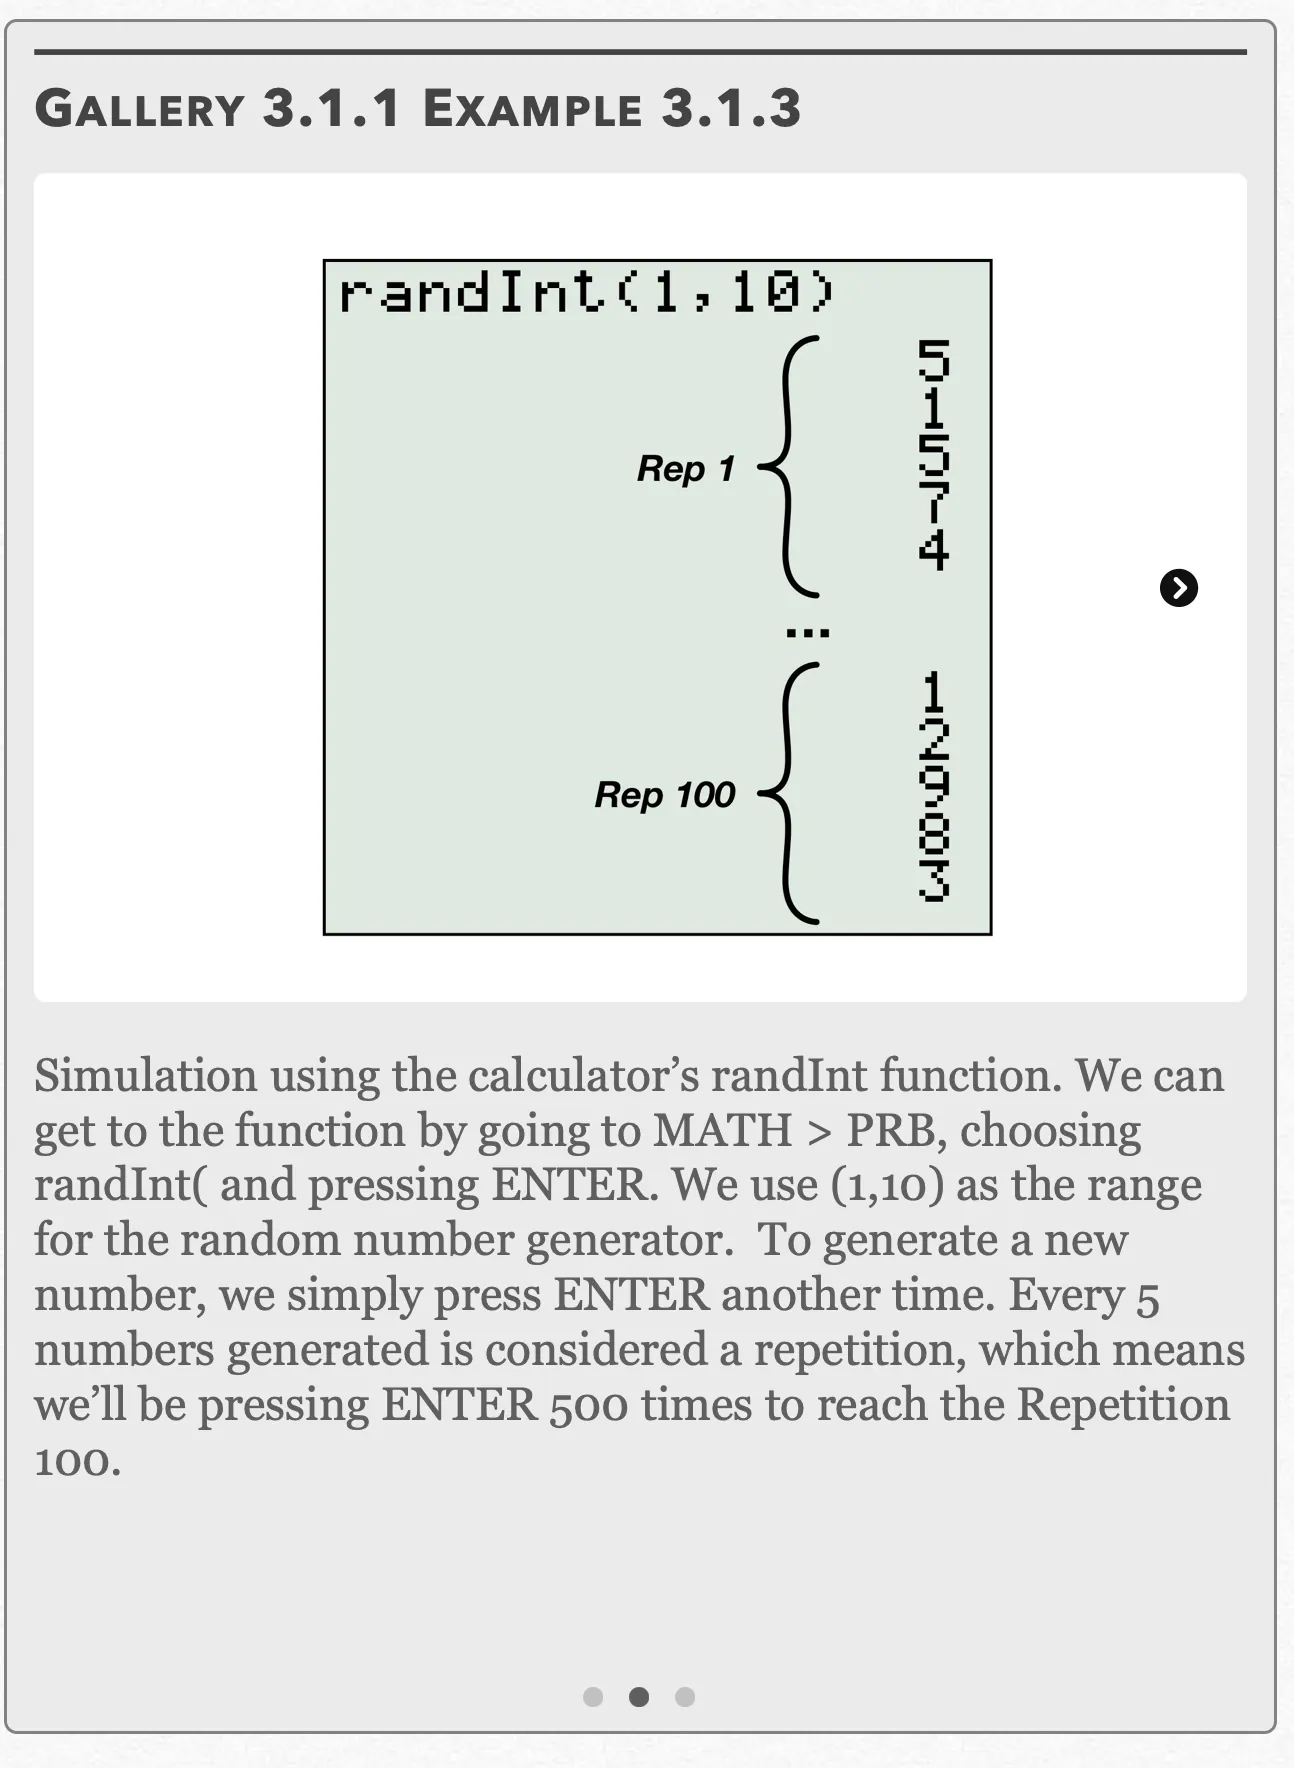
Simulation using the calculator’s randInt function. We can get to the function by going to MATH > PRB, choosing randInt( and pressing ENTER. We use (1,10) as the range for the random number generator. To generate a new number, we simply press ENTER another time. Every 5 numbers generated is considered a repetition, which means we’ll be pressing ENTER 500 times to reach the Repetition 100. Open full-size image S0210Frame 3 of 3
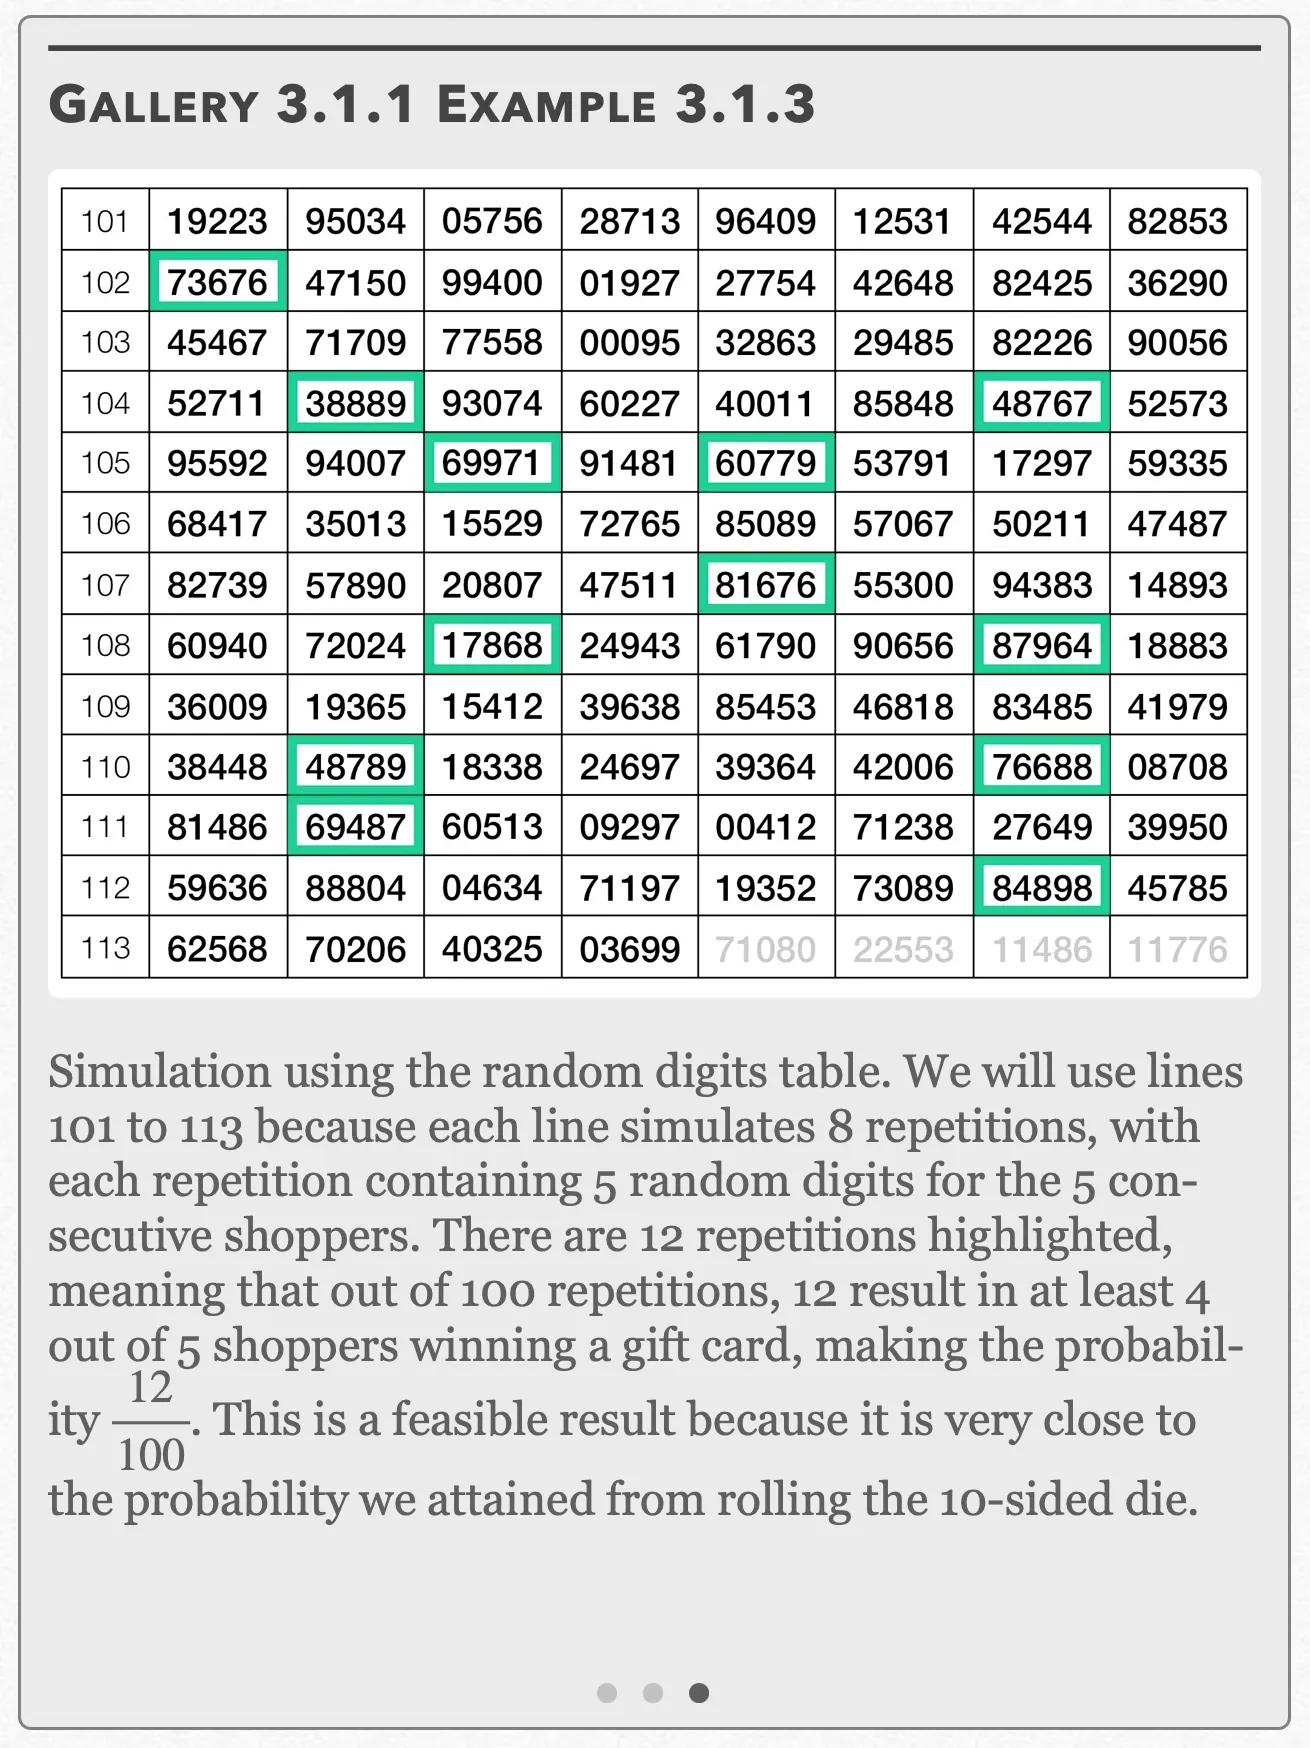
Simulation using the random digits table. We will use lines 101 to 113 because each line simulates 8 repetitions, with each repetition containing 5 random digits for the 5 consecutive shoppers. There are 12 repetitions highlighted, meaning that out of 100 repetitions, 12 result in at least 4 out of 5 shoppers winning a gift card, making the probability 12/100. This is a feasible result because it is very close to the probability we attained from rolling the 10-sided die. Open full-size image S0211
Capture provenance
Filename capture times, with no recorded timezone. Frames above follow the original gallery positions.
- · S0209 · displayed frame 1
Screenshot 2026-10-05 at 3.51.19 PM.png - · S0210 · displayed frame 2
Screenshot 2026-10-05 at 3.51.26 PM.png - · S0211 · displayed frame 3
Screenshot 2026-10-05 at 3.51.30 PM.png
The displayed die outcomes, in source order:
| Repetition | Roll 1 | Roll 2 | Roll 3 | Roll 4 | Roll 5 |
|---|---|---|---|---|---|
| 8 | 7 | 8 | 8 | 7 | 5 |
| 16 | 2 | 8 | 6 | 6 | 7 |
| 30 | 9 | 1 | 9 | 10 | 8 |
| 41 | 9 | 5 | 8 | 7 | 10 |
| 49 | 8 | 10 | 7 | 3 | 8 |
| 58 | 10 | 8 | 8 | 6 | 9 |
| 63 | 8 | 10 | 4 | 8 | 9 |
| 76 | 10 | 9 | 10 | 8 | 3 |
| 89 | 7 | 7 | 10 | 9 | 2 |
| 100 | 8 | 6 | 7 | 10 | 7 |
The random digits displayed in Gallery 3.1.1 frame 3:
| Row | Group 1 | Group 2 | Group 3 | Group 4 | Group 5 | Group 6 | Group 7 | Group 8 |
|---|---|---|---|---|---|---|---|---|
| 101 | 19223 | 95034 | 05756 | 28713 | 96409 | 12531 | 42544 | 82853 |
| 102 | 73676 | 47150 | 99400 | 01927 | 27754 | 42648 | 82425 | 36290 |
| 103 | 45467 | 71709 | 77558 | 00095 | 32863 | 29485 | 82226 | 90056 |
| 104 | 52711 | 38889 | 93074 | 60227 | 40011 | 85848 | 48767 | 52573 |
| 105 | 95592 | 94007 | 69971 | 91481 | 60779 | 53791 | 17297 | 59335 |
| 106 | 68417 | 35013 | 15529 | 72765 | 85089 | 57067 | 50211 | 47487 |
| 107 | 82739 | 57890 | 20807 | 47511 | 81676 | 55300 | 94383 | 14893 |
| 108 | 60940 | 72024 | 17868 | 24943 | 61790 | 90656 | 87964 | 18883 |
| 109 | 36009 | 19365 | 15412 | 39638 | 85453 | 46818 | 83485 | 41979 |
| 110 | 38448 | 48789 | 18338 | 24697 | 39364 | 42006 | 76688 | 08708 |
| 111 | 81486 | 69487 | 60513 | 09297 | 00412 | 71238 | 27649 | 39950 |
| 112 | 59636 | 88804 | 04634 | 71197 | 19352 | 73089 | 84898 | 45785 |
| 113 | 62568 | 70206 | 40325 | 03699 | 71080 | 22553 | 11486 | 11776 |
Pop Quiz 3.1.1
Glossary and deeper reading · 4 refreshers
These editorial refreshers supplement the reading. Definitions and examples are added guidance; original source wording and recorded answers remain in their original context.
-
Random sampling
Random sampling uses a specified chance process to select individuals from a population. It supports population inference when the sampling frame and data collection are appropriate, but does not guarantee perfect balance or eliminate every source of bias. For example, a random-number generator can select student identifiers from an enrollment list.
Read more: Random sampling in the captured Statistics reading →
-
Random assignment
Random assignment uses chance to allocate experimental units to treatment conditions. It tends to balance other influences across groups and supports causal inference in a well-conducted experiment, without guaranteeing identical groups. For example, shuffled labels can assign plants to two fertilizer treatments.
Read more: Random assignment in the captured Statistics reading →
-
Probability
Probability quantifies how likely an event is under a specified chance model. It lies between 0 and 1, with larger values representing greater likelihood. For example, drawing a red card from a well-shuffled standard deck has probability one half.
-
Simulation
A simulation imitates a chance process using a specified model. Repeated simulated outcomes can approximate probabilities when the model faithfully represents the situation. For example, random digits can model repeated draws from a bag with known color proportions.