2.11 Normal Models: Areas, Cutoffs and Relative Position
A Smooth Model for a Measured Quantity
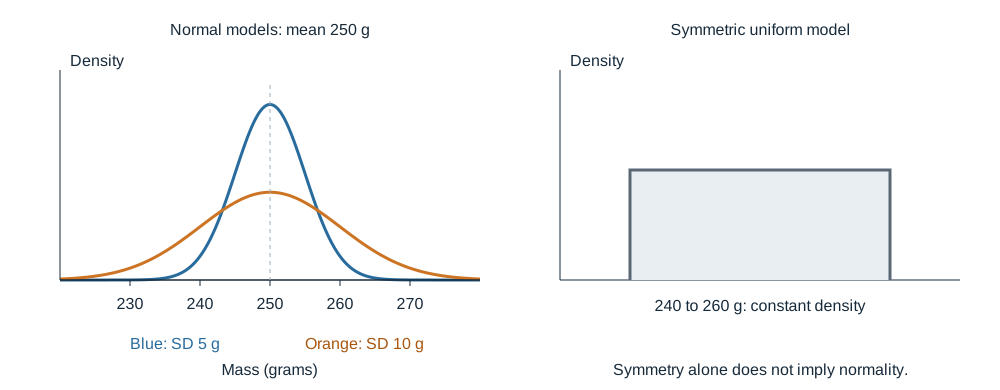
The mass of a coffee bag is a measurement, not a count. Within a measurement domain it can take intermediate values such as 249.6 g or 249.63 g. A continuous random variable can take any value within its specified domain, and intervals have probabilities. A normal curve is a useful approximation for many such variables, but it is not the model for every continuous or symmetric distribution.
A normal distribution is continuous, unimodal, bell-shaped and symmetric. It can model the distribution of observed data, and it can model probabilities for a continuous random variable representing a new observation. The curve has two parameters: its mean μ sets the center; its SD σ controls its width and height. With the same mean, smaller σ makes a taller, narrower curve; larger σ makes it shorter and wider. Each complete curve has area 1.
Worked Example: Parameters and Standard Normal
Suppose a supplied fill-mass model has mean 250 g and SD 5 g. Its one-SD marks are 245 and 255 g: the center is their midpoint, and the SD is the distance from the center to either mark. These are model parameters, not an observed sample mean and sample SD.
The standardized variable is . Its mean is , and its SD is . It therefore has the standard normal distribution, whose mean is 0 and SD is 1. Z has no gram units. This normal standardization is useful for areas; it does not require a general theory of combining arbitrary random variables.
Approximate Areas at One, Two and Three SDs
The empirical rule, or 68–95–99.7 rule, gives approximate percentages in a normal model: 68% within one SD of the mean, 95% within two, and 99.7% within three. For these coffee bags the intervals are 245–255 g, 240–260 g and 235–265 g. Symmetry splits a central region equally at the mean and splits its outside area into equal tails.
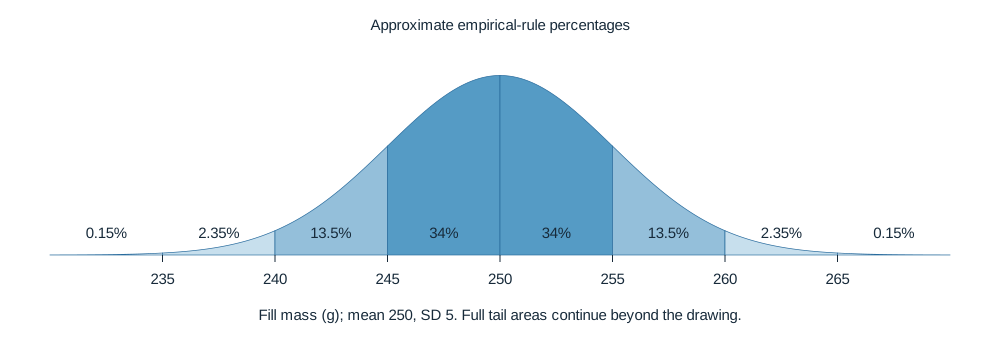
For example, 250–255 g contains about 34%. The band 255–260 g contains , and above 260 g is about . These are approximations, not exact normal-CDF results.
Calculate an Area from Given Bounds
If X is approximately normal, its probability within an interval is the curve area above that interval. The total area is 1. Let denote standard-normal left-tail area. Standardize each boundary and subtract left-tail areas for an interval.
For the supplied coffee model, below 245 g has z=−1 and probability about 0.158655. Above 260 g has z=2 and probability . Between 240 and 257 g has boundaries z=−2 and z=1.4:
About 89.65% of model-bags lie in that mass interval. A continuous normal model assigns probability 0 to one exact value; changing strict to inclusive endpoints does not change its area. This is different from a discrete distribution, where including a boundary can add positive probability. The ideal normal model extends along the real axis; its use for physical masses is an approximation near the relevant positive values, not a claim that negative masses occur.
Find Bounds from a Percentage
Now reverse the question. The lowest 10% has left-tail area 0.10 and standard-normal cutoff about −1.28155. Transform back: g. The highest 10% starts at about 256.408 g because its left-tail area is 0.90. A central 80% interval leaves 10% in each tail and uses those same two boundaries.
An inverse-normal tool can find the cutoff directly from area, mean and SD. A standard-normal table can instead find z whose left area is closest to the target; then use . Always identify whether the stated percentage is a left, right, central or two-tail area before using either method.
For a percentage number p between 0 and 100, lower bound and upper bound , the interval statements are:
These describe lowest-p%, between-bounds-p%, and highest-p% regions respectively. They are alternative region types, not three claims about one fixed pair of bounds.
The most extreme p% on both sides splits that percentage equally:
For the most extreme 10%, each tail is 5%, using z≈±1.64485. The coffee-model bounds are about 241.776 and 258.224 g; the extreme event is below the lower bound or above the upper bound. Do not put 10% in each tail—that would make 20% extreme overall.
Compare with Percentiles and Proportions
Raw values from different models may not be directly comparable. A 254 g bag in the mean 250/SD 5 model has z=.8 and percentile about 78.81. A 508 g bag in a separate mean 500/SD 12 model has z≈.667 and percentile about 74.75. The first reading is higher relative to its own model despite its smaller raw mass. About 21.19% of the first model lies above 254 g, compared with 25.25% of the second above 508 g.
Percentiles and above/below proportions let us compare relative position within one normal model or between models. State the model and area direction along with the number. A z-score supports the area calculation, but the percentile or proportion explains how much of the modeled population is below or above the observation.
Try It Yourself
The following original practice applies the ideas above to a fresh setting. Show the reasoning requested in each part. Answers and task-specific rubrics are on the separate solutions page.
Original generated practice for the Fall 2026 course.
Glossary and deeper reading · 9 refreshers
These editorial refreshers supplement the reading. Definitions and examples are added guidance; original source wording and recorded answers remain in their original context.
-
Random variable
A random variable assigns a numerical value to each outcome of a chance process. Its value is uncertain before the outcome is observed, and its distribution gives the probabilities of possible values. For example, the number of red cards in three draws is a random variable.
Read more: Random variable in the captured Statistics reading →
-
Probability
Probability quantifies how likely an event is under a specified chance model. It lies between 0 and 1, with larger values representing greater likelihood. For example, drawing a red card from a well-shuffled standard deck has probability one half.
-
Normal distribution
A Normal distribution is a continuous, symmetric bell-shaped distribution determined by its mean and standard deviation. Many symmetric distributions are not Normal, so symmetry by itself is insufficient. For example, a Normal model centered at 50 with standard deviation 5 places most values relatively close to 50.
Read more: Normal distribution in the captured Statistics reading →
-
Unimodal distribution
A unimodal distribution has one main peak. The peak marks a region where observations or probability are especially concentrated. For example, a histogram of heights might have one prominent peak around the most common height interval.
Read more: Unimodal distribution in the captured Statistics reading →
-
68–95–99.7 rule
For a Normal distribution, approximately 68%, 95%, and 99.7% of values lie within one, two, and three standard deviations of the mean. The rule is an approximation for Normal or sufficiently bell-shaped data, rather than for every distribution. For example, a Normal model with mean 50 and standard deviation 5 places about 95% of values between 40 and 60.
Read more: 68–95–99.7 rule in the captured Statistics reading →
-
Mean
The mean is a measure of center often called an average. For a finite data set, the arithmetic mean is the sum of the values divided by their number; for a random variable, the mean is its probability-weighted expected value when that value exists. Means can be pulled toward extreme values and are not generally resistant. For example, the arithmetic mean of 2, 4, and 9 is 5.
-
Percentile
A percentile identifies a location in an ordered distribution by the proportion below or at that location. Ties and finite samples require a stated convention, so methods can produce slightly different percentile values. For example, the 80th percentile marks a value with roughly 80% of observations at or below it.
Read more: Percentile in the current summary-statistics lesson →
-
Z-score
A z-score expresses a value’s distance from its distribution’s mean in standard-deviation units. It is found by subtracting the mean from the value and dividing by the standard deviation. For example, a z-score of −1.5 places the value 1.5 standard deviations below the mean.
-
Population
A population is the full set of individuals or measurements a study aims to describe. It must be defined clearly before deciding whether a sample supports generalization. For example, all students enrolled in a particular school this year form a population.