Scatterplots: Preserve, Describe, and Defend the Pattern
Two numerical measurements on the same individual tell a story that two separate lists cannot. A scatterplot keeps the pairing visible. Its purpose is to show how values of one variable tend to accompany values of the other, including exceptions to the pattern.
Keep the Pairs
A bivariate quantitative data set contains ordered pairs from two quantitative variables, collected from the same individuals in a sample or population. Suppose five students each study a word list for a recorded number of minutes and then complete the same recall activity. Each row below is one student’s pair; it is not permissible to sort the two columns separately and invent new pairs.
| Student | Study time, x (minutes) | Words recalled, y (count) |
|---|---|---|
| A | 0 | 5 |
| B | 10 | 8 |
| C | 20 | 10 |
| D | 30 | 14 |
| E | 40 | 16 |
The explanatory variable is placed on the horizontal x-axis. It is the variable used to explain or predict the corresponding response. The response variable is placed on the vertical y-axis. Here, study time explains or predicts recall count; recalling five words is not a fifth minute of study. Axis labels must identify both variables and their units.
Worked Example: Construct the Plot
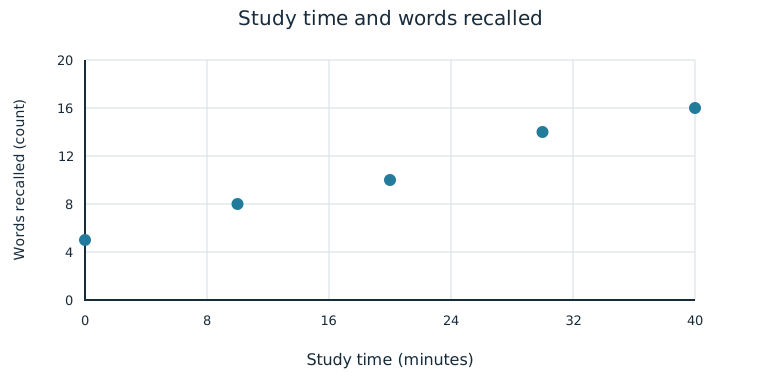
Choose scales that include every observation: 0–40 minutes horizontally and 0–20 words vertically. For student B, move to x=10 minutes and y=8 words, then place one point. Repeat for all five ordered pairs. Do not draw a bar for each student or a line that claims a time sequence. Scatterplot points need not be joined.
Describe the Association
Describe form, direction, strength, and unusual features. Form may be linear or non-linear if a pattern exists. A linear pattern follows an approximately straight path; a non-linear pattern bends. Direction may be positive or negative: in a positive association, response values tend to increase as explanatory values increase; in a negative association, they tend to decrease. An association says “tend to,” rather than promising the same result for every individual.
Strength describes how closely points follow the general pattern. Strong points cluster closely around that pattern; moderate points have more scatter; weak points have substantial scatter. Strength is judged relative to the pattern, which may itself be curved. A steep slope alone does not make an association strong. An unusual feature may be a cluster of individuals or an individual point that does not fit the general pattern.
For the recall plot, the form is approximately linear, the direction is positive, and the points follow the pattern closely. There is no obvious isolated point or separate cluster. A useful sentence is: “For these five students, longer study times are associated with larger recall counts in a strong, approximately linear pattern.” The context and observed group are part of the description.
Worked Comparison: A Curve
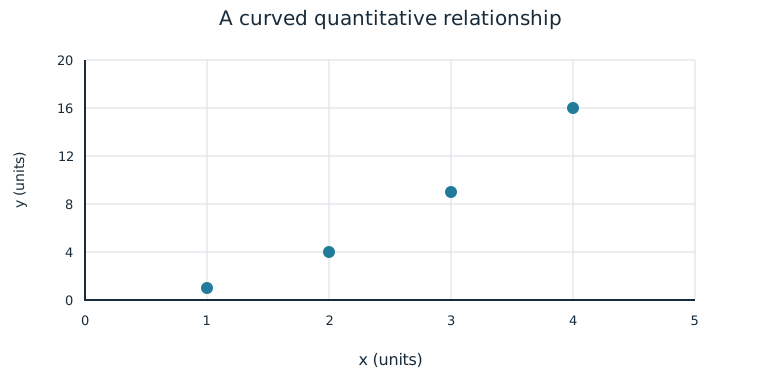
The pairs (1,1), (2,4), (3,9), and (4,16) trace an upward curve rather than a straight line. Their association is positive and strong, but non-linear. A description that says only “strong positive” leaves out the form; a line is not automatically appropriate because the points follow some pattern closely.
Justify a Graphical Claim
A scatterplot can support a claim about the relationship between two numeric variables. State the claim, cite a relevant feature of the plotted observations, and explain how the feature bears on that claim. For example, the student with 10 minutes of study recalls 8 words, while the student with 30 minutes recalls 14; the other points follow the same general upward pattern. These comparisons support a positive association in this observed group.
One favorable pair is weaker evidence than a pattern across the plot. An exceptional point can limit a claim that every individual follows a rule. The plot also does not, by itself, tell how the students were selected or whether study times were randomly assigned. A visual relationship should not silently become a cause-and-effect conclusion. The independent practice asks you to construct and defend your own description from complete paired observations.
Independent Practice
Use the information in each question to make your own calculation, representation, or argument. Explain what your result means in its setting.
Original generated practice for the Fall 2026 course.
Glossary and deeper reading · 9 refreshers
These editorial refreshers supplement the reading. Definitions and examples are added guidance; original source wording and recorded answers remain in their original context.
-
Scatterplot
A scatterplot displays paired values of two quantitative variables as points. The horizontal coordinate represents one variable and the vertical coordinate represents the other. For example, plotting hours studied against test scores helps reveal a pattern without establishing causation.
-
Quantitative variable
A quantitative variable records a numerical count or measurement for each individual. Differences between its values have a meaningful numerical interpretation. For example, the number of books borrowed and the mass of a backpack are quantitative variables.
Read more: Quantitative variable in the captured Statistics reading →
-
Sample
A sample is the subset of a population actually studied. How it is selected matters for the conclusions that can be drawn about the population. For example, 60 selected students may be a sample from a school’s full enrollment.
-
Explanatory variable
An explanatory variable is used to predict or explain variation in a response variable. In an experiment, researchers deliberately assign values or treatments related to an explanatory variable. For example, assigned study time could be an explanatory variable when test score is the response.
Read more: Explanatory variable in the captured Statistics reading →
-
Response variable
A response variable records the outcome being studied. Its relationship to an explanatory variable can be investigated without assuming that the explanatory variable causes it. For example, plant height is a response when researchers compare fertilizer treatments.
Read more: Response variable in the captured Statistics reading →
-
Positive association
Two variables have a positive association when larger values of one tend to accompany larger values of the other. Individual observations need not follow the tendency perfectly. For example, taller trees may tend to have wider trunks.
Read more: Positive association in the captured Statistics reading →
-
Negative association
Two variables have a negative association when larger values of one tend to accompany smaller values of the other. The tendency can be linear or curved and does not by itself show cause and effect. For example, higher fuel efficiency may accompany lower fuel use per mile.
Read more: Negative association in the captured Statistics reading →
-
Random assignment
Random assignment uses chance to allocate experimental units to treatment conditions. It tends to balance other influences across groups and supports causal inference in a well-conducted experiment, without guaranteeing identical groups. For example, shuffled labels can assign plants to two fertilizer treatments.
Read more: Random assignment in the captured Statistics reading →
-
Statistical independence
Statistical independence means that learning one outcome does not change the probability distribution of another. For two events, it implies that the probability of both occurring equals the product of their probabilities. For example, independent draws with replacement keep the second draw’s color probabilities unchanged by the first.
Read more: Statistical independence in the captured Statistics reading →