Errors and Power: Detecting a Difference Without Claiming Certainty
These lessons and problems are newly written for the revised course. Worked examples show complete reasoning; the application questions ask you to make and defend your own choices.
Separate the truth from the decision
Imagine deciding whether a food shipment’s contamination proportion exceeds an acceptable baseline. A test decision is based on a sample, so even a well-designed procedure can be wrong. A Type I error rejects a true null: the small p-value suggests an alternative that is actually false. A Type II error fails to reject a false null: the p-value is not small, yet a real population difference exists. The same phrases become meaningful only after naming the population truth and the practical decision.
| Population truth | Reject the null | Fail to reject |
|---|---|---|
| Null true | Type I: false alarm | Correct decision |
| Specified alternative true | Correct detection | Type II: missed difference |
PowerEditorial qualification: The captured text describes power as detecting a Type II error. Power is the probability of correctly rejecting the null hypothesis for a specified true alternative, equal to 1 − β. is the probability of correctly rejecting a false null at a specified population alternative. It is not a probability that the null is false in today’s study. One sample’s result does not determine the population truth, and failure to reject must not be called accepting or proving that truth.
A corrected, fully specified packet-mass model
The following new modeling information makes a complete probability calculation possible: packet masses are independently drawn from a Normal population with known σ=0.010 kg, n=5, target μ₀=18.000 kg. This supplied probability model illustrates power; the required mean-inference method elsewhere uses t when population σ is unknown. The standard deviation of the sample mean is σ/√n=0.00447214 kg, not σ/n. A two-sided rule rejects when x̄ lies outside 18.000±1.96(0.00447214), so its failure-to-reject interval is [17.9912346,18.0087654] kg.
Under the target mean the false-alarm probability is 2P(Z>1.96)≈0.05. This is α: reject probability conditional on a true null. Now assume the population mean is actually 18.015 kg. The same boundaries standardize to approximately −5.31410 and −1.39410 under that shifted population. The Type II probability is the area between these boundaries under the shifted sampling distribution.
Thus about 8.16% of repeated checks miss this particular shift, while about 91.84% detect it. The small left-boundary probability must be subtracted, even though it is nearly zero. Labeling 0.0816 as power reverses the meaning. Both β and power are conditional on μ=18.015; α is conditional on μ=18.000. Change the true mean and the detection probability can change.
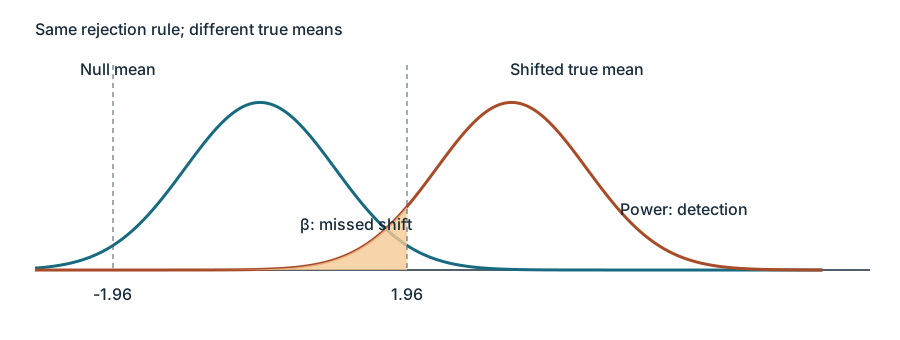
Four ways to make detection easier
For a given test and specified alternative, low Type II probability means high power: for example, β=0.20 corresponds to power=0.80. Holding other relevant settings fixed, power increases when sample size increases, standard error decreases, the true parameter is farther from the null, or significance level α increases. These relationships describe a probability procedure, not a promise about an individual sample. Sample size and standard error are connected: increasing n commonly helps by reducing SE.
Consider the supplied one-sided model that rejects Z>1.644854 at α=0.05. Under a true standardized effect θ/SE, power=Φ(θ/SE−1.644854). With θ=0.15 and SE=0.10, power≈0.4424. Doubling n reduces SE to 0.10/√2, giving power≈0.6831. Reducing measurement variability at the original n so SE=0.08 gives ≈0.5910. Moving the true parameter to 0.25 at original SE gives ≈0.8038. Raising α to 0.10 lowers the critical threshold to 1.281552 and gives ≈0.5865. Each calculation compares a stated alternative and design; the sample-size change acts through SE rather than pretending both can vary independently.
Higher confidence in an interval uses a larger critical multiplier, while higher α in a test makes rejection easier. Keep these two “higher” settings separate: they refer to different procedure goals.
Use consequences before collecting data
In the food-shipment setting, a false alarm can destroy safe food; a missed contaminated shipment can expose customers. Type II consequences may dominate there. In another setting, such as a costly medical follow-up triggered by an exploratory screen, a false alarm may deserve more emphasis. Compare both consequences before designing the study; there is no universal more-serious error.
Because α is the Type I probability, false-alarm consequences guide its choice. Lowering α reduces false rejection under the null but usually lowers power at a fixed alternative and sample size. Because n affects Type II probability, sample-size planning can improve the chance of detecting a harmful effect while retaining a cautious α. Better measurement precision may also help. Cost, feasibility, the smallest consequential difference, and both kinds of error belong in that planning discussion. Power 0.83 at contamination p=0.04 means a 17% miss probability at that alternative; it does not assign 17% to every conceivable contaminated proportion.
Independent Application
Work through each investigation before opening the separate solutions. State parameters, show calculations and connect your reasoning to the actual study.
Original generated practice for the Fall 2026 course.
Glossary and deeper reading · 11 refreshers
These editorial refreshers supplement the reading. Definitions and examples are added guidance; original source wording and recorded answers remain in their original context.
-
Sample
A sample is the subset of a population actually studied. How it is selected matters for the conclusions that can be drawn about the population. For example, 60 selected students may be a sample from a school’s full enrollment.
-
Type I error
A Type I error occurs when a test rejects a true null hypothesis. The test’s significance level controls its probability under the null model. For example, a study might report a treatment difference even though the population treatment effects are equal.
Read more: Type I error in the captured Statistics reading →
-
Statistical power
Editorial qualification: The captured text describes power as detecting a Type II error. Power is the probability of correctly rejecting the null hypothesis for a specified true alternative, equal to 1 − β.
Statistical power is the probability of rejecting the null hypothesis for a specified true alternative. It equals 1 minus the Type II error probability for that alternative and can increase with a larger sample or a larger true effect. For example, a study with power 0.8 detects its specified alternative in about 80% of repeated studies under the model.
Read more: Statistical power in the captured Statistics reading →
-
Probability
Probability quantifies how likely an event is under a specified chance model. It lies between 0 and 1, with larger values representing greater likelihood. For example, drawing a red card from a well-shuffled standard deck has probability one half.
-
Population
A population is the full set of individuals or measurements a study aims to describe. It must be defined clearly before deciding whether a sample supports generalization. For example, all students enrolled in a particular school this year form a population.
-
Probability model
A probability model specifies possible outcomes and probabilities for events formed from those outcomes. Probabilities are nonnegative, and the probability of the whole sample space is 1. In a discrete model, individual outcome probabilities sum to 1; in a continuous density model, total area is 1 even though each single value has probability 0. For example, a fair four-sided die can be modeled with four outcomes each assigned probability one quarter.
Read more: Probability model in the captured Statistics reading →
-
Mean
The mean is a measure of center often called an average. For a finite data set, the arithmetic mean is the sum of the values divided by their number; for a random variable, the mean is its probability-weighted expected value when that value exists. Means can be pulled toward extreme values and are not generally resistant. For example, the arithmetic mean of 2, 4, and 9 is 5.
-
Sampling distribution
A sampling distribution describes how a statistic varies across all possible samples drawn under a specified sampling design and sample size. It is a distribution of statistics rather than of individual observations. For example, the proportions from repeated random samples of 60 students form a sampling distribution.
Read more: Sampling distribution in the captured Statistics reading →
-
Standard error
A standard error describes the standard deviation of a statistic’s sampling distribution, usually estimated from data. It measures uncertainty in an estimate rather than the spread of individual observations. For example, the estimated standard error of a sample mean is the sample standard deviation divided by the square root of the sample size.
Read more: Standard error in the captured Statistics reading →
-
Population parameter
A population parameter is a numerical feature of the population or probability model being studied. It is fixed for that defined population, although its value may be unknown. For example, the true proportion of all enrolled students who walk to school is a parameter.
Read more: Population parameter in the captured Statistics reading →
-
One-sided test
A one-sided test seeks evidence for a specified direction of departure from the null claim. Its relevant extreme outcomes lie in one direction of the test statistic’s distribution. For example, a greater-than alternative asks whether a population mean exceeds a stated value.
Read more: One-sided test in the captured Statistics reading →