Five-Number Summaries and Boxplots
A boxplot summarizes ordered position and spread with a few marks. It is useful for comparison because it uses a common numerical axis, but it deliberately leaves out the exact values and some shape details. Learn what each mark represents before interpreting the pattern.
Construct the Boxplot
The five-number summary is minimum, Q1, median, Q3, and maximum. For 4,6,8,10,12,14,16,18 minutes, using medians of halves, it is 4,7,11,15,18. Draw a box from Q1 to Q3, place a line at the median, and extend whiskers from the quartiles toward the lower and upper extremes. The box represents the nominal middle half of the distribution. Without separately marked outliers, the regions beyond Q1 and Q3 represent roughly the lower and upper quarter, respectively. These are nominal portions: ties and the quartile convention for finite data can prevent exactly 25% of observations from falling in each region.
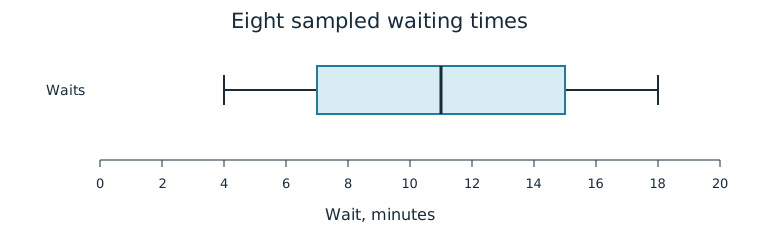
With outliers, a modified boxplot draws whiskers only to the most extreme data values that are not outliers and plots outliers separately using an asterisk, dot, or other clearly explained symbol. Use a stated outlier rule. The upper fence itself is not a data value and is not automatically the whisker endpoint. The outer quarter regions then include both the shortened whisker regions and any separately marked outliers; do not claim that each shortened whisker alone contains exactly 25% of the observations.
Worked Example: An Outlier Changes a Whisker
For 1,2,3,4,5,6,7,24 minutes, the five-number summary is 1,2.5,4.5,6.5,24. IQR=4 gives fences −3.5 and 12.5, so 24 is an outlier. The modified boxplot’s upper whisker ends at 7, the largest non-outlier, and a separate point marks 24. The maximum remains 24 in the five-number summary; it has not vanished because the whisker is shorter.
A complete construction labels the measurement axis and units, places all five-number positions accurately, states whether outlier marking is used, and accounts for any separately plotted extreme observations. An unscaled rectangle with an unlabeled line is not enough to show the actual summary.
Mean, Median, and Shape
For relatively symmetric distributions, mean and median are relatively close. Right-skewed distributions usually have mean greater than median because the high tail pulls the mean upward; left-skewed distributions usually have mean less than median. These are useful typical relationships, not a guarantee that one boxplot uniquely determines the mean or the entire distribution.
The usual boxplot displays the median, not the mean. If a comparison needs both, use the complete data or a separately supplied mean. In the outlier example, mean=6.5 minutes and median=4.5 minutes, consistent with a high right tail. We know the mean from all eight data values, not because the whisker endpoint equals 7.
Worked Example: Read With Restraint
A symmetric-looking box and whiskers can suggest a relatively balanced distribution, but they hide internal clusters and modes. Two samples can share all five-number values and have different values between them. Describe what the positions show, connect mean/median comparisons to available information, and leave unobserved detail open.
Independent Practice
Use the information in each question to make your own calculation, representation, or argument. Explain what your result means in its setting.
Original generated practice for the Fall 2026 course.
Glossary and deeper reading · 7 refreshers
These editorial refreshers supplement the reading. Definitions and examples are added guidance; original source wording and recorded answers remain in their original context.
-
Boxplot
A boxplot displays the median and quartiles with a box and extending whiskers. A modified boxplot uses whiskers ending at the most extreme observations within the outlier fences and plots flagged observations separately. For example, parallel boxplots can compare the centers and spreads of two classes’ scores.
-
Five-number summary
A five-number summary contains the minimum, first quartile, median, third quartile, and maximum. These values summarize the location and spread of ordered numerical data. For example, the summary 2, 4, 7, 10, and 15 identifies a median of 7 and an IQR of 6.
Read more: Five-number summary in the captured Statistics reading →
-
Median
The median is the middle of an ordered numerical data set. For an even number of observations, it is the average of the two middle values under the usual convention. For example, the median of 2, 4, and 20 is 4.
-
Outlier
An outlier is an observation unusually far from the overall pattern. The 1.5-IQR rule flags possible outliers below the first quartile minus 1.5 IQR or above the third quartile plus 1.5 IQR. For example, a very long commute may be flagged for investigation without automatically being a recording error.
-
Observation
An observation is a recorded value or set of values for an individual or occasion. The individual may be a person, object, or event rather than a human subject. For example, one plant’s measured height is an observation in a plant-growth study.
-
Symmetric distribution
A symmetric distribution has approximately matching shapes on either side of its center. Symmetry alone does not establish that a distribution is Normal. For example, a uniform distribution over a centered interval is symmetric but has a flat rather than bell-shaped density.
Read more: Symmetric distribution in the captured Statistics reading →
-
Mean
The mean is a measure of center often called an average. For a finite data set, the arithmetic mean is the sum of the values divided by their number; for a random variable, the mean is its probability-weighted expected value when that value exists. Means can be pulled toward extreme values and are not generally resistant. For example, the arithmetic mean of 2, 4, and 9 is 5.