Estimating a Proportion: Confidence, Precision and a Population Claim
These lessons and problems are newly written for the revised course. Worked examples show complete reasoning; the application questions ask you to make and defend your own choices.
The sample gives an estimate, not the whole population
A school wants to know what proportion of its enrolled students prefer a new breakfast menu. Asking every student may be impractical, but a carefully chosen sample can estimate the population response. The unknown parameter p is the proportion of all enrolled students who prefer the proposed breakfast menu. That definition includes the numerical kind of parameter, the response and the population. A sample proportion p̂ is calculated from the observed sample; it changes when another sample is selected.
A confidence interval is an interval estimate for a population parameter. For one binary response from one randomly selected sample, use a one-sample z-interval for a population proportion. It begins with the sample proportion as a point estimate and adds a margin for sampling variation. The interval estimates p; it does not predict which particular students prefer breakfast or put individual yes/no responses into a numerical interval.
In a new worked example, an SRS of 180 students is drawn without replacement from 4,000 enrolled students. Of those selected, 117 prefer the proposal. The point estimate is 117/180=0.65. Even if the procedure is sound, a different random sample could give a different p̂. Reporting only “65%” conceals that sampling uncertainty. Our goal is a range of plausible values for the population proportion, with a stated confidence method.
Check the design and the observed counts
Three checks justify the ordinary z-interval approximation. The data should come from a random sample. When sampling without replacement, verify n≤0.10N, equivalently N≥10n. Finally, both observed successes n p̂ and failures n(1−p̂) should be at least 10. The two count checks support a reasonably normal sampling-distribution approximation; random selection and the sampling fraction address different aspects of the design.
For the breakfast example, the SRS supplies randomization and 180≤0.10(4,000)=400 verifies the fraction. Observed successes are 117 and failures are 63, both at least 10. These are observed counts because the unknown p is being estimated. Substituting a convenient hypothetical p₀ changes the question and does not repair too few actual successes.
A voluntary website survey can have thousands of responses and still lack random selection. An SRS of 120 from only 900 people can have balanced successes and failures yet violate 120≤90. An SRS of 60 with just four successes can satisfy the design checks but fail the count condition. A complete justification uses the actual context and all three checks, rather than treating “large sample” as permission to calculate everything.
From standard error to endpoints
The standard error is an estimate of the standard deviation of the sampling distribution of a statistic. Here it estimates typical sample-proportion variation around the fixed population p. It is not the standard deviation of an individual yes/no response. Estimate it with the observed sample proportion, then multiply by a critical value to obtain a margin of error.
The critical value z* is chosen so that −z* and +z* enclose the central C% of the standard normal distribution. For approximately 95% confidence, z*=1.96. The breakfast sample gives SE=√[0.65(0.35)/180]≈0.0355512. Its margin is 1.96(0.0355512)≈0.0696804. Thus the interval is 0.65±0.0696804, approximately (0.5803196,0.7196804).
| Quantity | Value | Meaning |
|---|---|---|
| Point estimate | 0.6500 | Observed preference proportion |
| SE | 0.03555 | Estimated repeated-sample proportion variation |
| MOE | 0.06968 | Extension from estimate to either endpoint |
| Full width | 0.13936 | Twice the margin of error |
The lower endpoint is about 0.5803 and the upper about 0.7197. The full width extends in both directions; MOE is half that width. These units are proportions: the margin is about 6.97 percentage points, not a 6.97% relative increase in breakfast preference.
Interpret the range and the method separately
We are 95% confident that the population proportion of enrolled students preferring the breakfast proposal lies between about 0.5803 and 0.7197. This is a statement about p for the named school population. The range contains values we regard as plausible given the sample and procedure. Since its entire range exceeds 0.50, it supplies convincing evidence that a majority of enrolled students prefer the proposal.
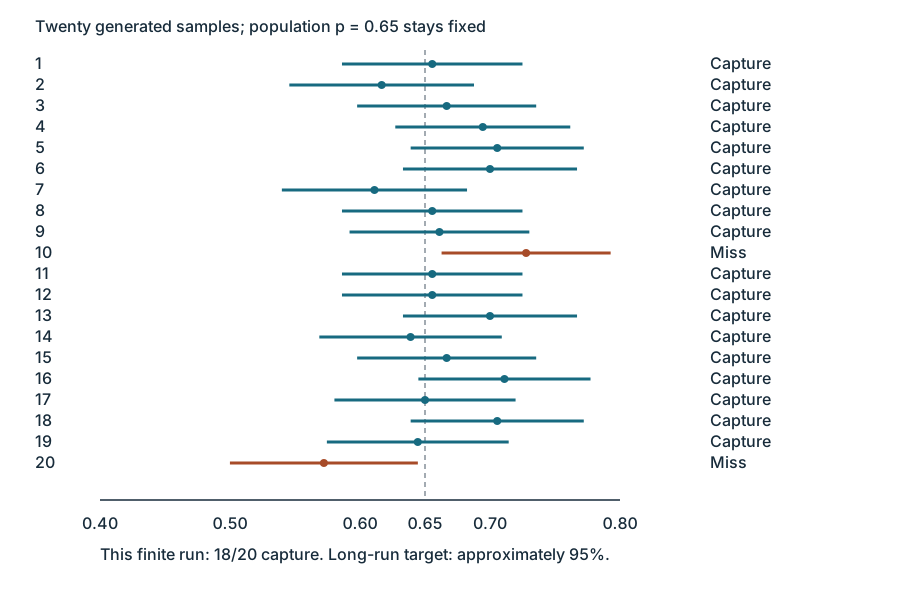
The confidence level describes the method: in repeated random sampling with the same sample size, approximately 95% of intervals constructed this way would capture the fixed population proportion. A particular computed interval either contains p or does not. It may miss, even though the method has 95% confidence; the statement does not mean p moves randomly among the endpoints or that 95% of students lie in that range.
The figure repeats the same sampling and calculation method in a generated population with known p=0.65. Knowing the simulation truth lets us identify captures and misses. In a real survey the unknown truth prevents us from labeling our one interval with certainty. A small finite run need not have exactly the advertised capture percentage.
If an otherwise valid interval were (0.47,0.63), both minority and majority values would be plausible. That interval would not give convincing evidence for a majority, and it would not prove a majority absent. Use the range to justify the actual investigative claim rather than attaching a conclusion mechanically to the word “confidence.”
Choose precision and confidence before sampling
For a fixed sample, greater confidence encloses more of the normal curve and needs a larger z*. Therefore the critical value, margin of error and interval width all increase. In the breakfast sample, the same SE≈0.0355512 gives margins about 0.05848 at 90% (z*=1.645), 0.06968 at 95% (1.96), and 0.09158 at 99% (2.576). A narrower interval from the same data cannot retain the same capture guarantee simply by changing the label.
At fixed confidence and comparable p̂, larger n reduces SE and tends to narrow the interval. The width is approximately proportional to 1/√n. Moving from n=180 to n=720 while retaining p̂=0.65 halves SE, margin and width. It does not quarter the width: four times the observations give only about twice the precision.
For planning, rearrange the MOE formula before data collection:
Suppose a town with 100,000 residents wants a 95% margin at most 0.03. A pilot estimate 0.65 gives planned n=1.96²(0.65)(0.35)/0.03²≈971.0711, so use at least 972. If a sample-proportion estimate is not defined or cannot be calculated, use 0.50. This maximizes p̂(1−p̂) at 0.25 and gives the conservative upper bound n≈1067.1111, hence 1,068. Always round up for a minimum-size requirement. Both proposed sizes meet the town sampling fraction, but the later realized data still need random selection and both observed-count checks. Planning is not evidence that a survey has already been completed.
Independent Application
Work through each investigation before opening the separate solutions. State parameters, show calculations and connect your reasoning to the actual study.
Original generated practice for the Fall 2026 course.
Glossary and deeper reading · 17 refreshers
These editorial refreshers supplement the reading. Definitions and examples are added guidance; original source wording and recorded answers remain in their original context.
-
Sample
A sample is the subset of a population actually studied. How it is selected matters for the conclusions that can be drawn about the population. For example, 60 selected students may be a sample from a school’s full enrollment.
-
Population
A population is the full set of individuals or measurements a study aims to describe. It must be defined clearly before deciding whether a sample supports generalization. For example, all students enrolled in a particular school this year form a population.
-
Confidence interval
A confidence interval is a data-based range produced by a method with a specified long-run coverage rate for a population parameter. For a fixed population, the calculated interval either contains the parameter or it does not; the confidence level describes the method over repeated samples. For example, a 95% method captures the true parameter in about 95% of repeated intervals when its assumptions hold.
Read more: Confidence interval in the captured Statistics reading →
-
Population parameter
A population parameter is a numerical feature of the population or probability model being studied. It is fixed for that defined population, although its value may be unknown. For example, the true proportion of all enrolled students who walk to school is a parameter.
Read more: Population parameter in the captured Statistics reading →
-
Simple random sample
A simple random sample of a fixed size gives every possible subset of that size the same chance of selection. Giving individuals equal selection chances alone does not establish that the design is an SRS. For example, randomly choosing three identifiers without replacement from ten gives an SRS when every three-identifier set is equally likely.
Read more: Simple random sample in the captured Statistics reading →
-
Sampling without replacement
Sampling without replacement does not return selected items before later selections. Selections from a finite population are dependent, although treating them as approximately independent can be reasonable when the sample is a small fraction of the population. For example, selecting students without replacement ensures that no student is chosen twice.
Read more: Sampling without replacement in the captured Statistics reading →
-
Random sampling
Random sampling uses a specified chance process to select individuals from a population. It supports population inference when the sampling frame and data collection are appropriate, but does not guarantee perfect balance or eliminate every source of bias. For example, a random-number generator can select student identifiers from an enrollment list.
Read more: Random sampling in the captured Statistics reading →
-
Observed count
An observed count is the actual number of sampled individuals in a category or table cell. It is compared with the expected count to measure disagreement with a null model. For example, if 13 sampled students chose walking, the observed count for walking is 13.
Read more: Observed count in the current two-way chi-square lesson →
-
Survey
A survey collects information by asking individuals questions. Its quality depends on the sample design, question wording, and responses received. For example, a school can survey selected families about their transportation needs.
-
Standard error
A standard error describes the standard deviation of a statistic’s sampling distribution, usually estimated from data. It measures uncertainty in an estimate rather than the spread of individual observations. For example, the estimated standard error of a sample mean is the sample standard deviation divided by the square root of the sample size.
Read more: Standard error in the captured Statistics reading →
-
Standard deviation
Standard deviation measures spread around the mean using squared deviations and a square root. A sample standard deviation uses the sum of squared deviations divided by one less than the sample size before taking the square root. For example, a larger standard deviation of travel times indicates greater variability, in the original time units.
Read more: Standard deviation in the captured Statistics reading →
-
Critical value
A critical value is a cutoff from a reference distribution chosen for a confidence level or testing rule. The relevant distribution, degrees of freedom, and one-sided or two-sided procedure determine the cutoff. For example, a symmetric 95% Normal interval uses a cutoff near 1.96 standard-error units.
Read more: Critical value in the captured Statistics reading →
-
Standard Normal distribution
The standard Normal distribution has mean 0 and standard deviation 1. Standardizing a Normal random variable produces this common probability scale. For example, a standardized value of 2 lies two standard deviations above the standard Normal mean.
Read more: Standard Normal distribution in the captured Statistics reading →
-
Population proportion
A population proportion is the fraction of the entire population with a specified characteristic. It is a parameter, commonly written p, that a sample proportion can estimate. For example, the fraction of all enrolled students who walk to school is the population proportion of walkers.
Read more: Population proportion in the captured Statistics reading →
-
Mean
The mean is a measure of center often called an average. For a finite data set, the arithmetic mean is the sum of the values divided by their number; for a random variable, the mean is its probability-weighted expected value when that value exists. Means can be pulled toward extreme values and are not generally resistant. For example, the arithmetic mean of 2, 4, and 9 is 5.
-
Simulation
A simulation imitates a chance process using a specified model. Repeated simulated outcomes can approximate probabilities when the model faithfully represents the situation. For example, random digits can model repeated draws from a bag with known color proportions.
-
Margin of error
A margin of error is the amount added to and subtracted from a point estimate in a symmetric confidence interval. In the procedures here it combines a critical value with an estimated standard error and addresses modeled sampling variability. For example, an estimate of 40% with a margin of 3 percentage points gives an interval from 37% to 43%.
Read more: Margin of error in the captured Statistics reading →