2.3 Drawing Conclusions about Studies
Section Overview
Scope of Inference
Researchers who conduct statistical studies often want to draw conclusions, or make inferences, that go beyond the data produced.
What types of inference can be made from a particular study? The answer depends on the design of the study. Random selection of individuals allows inference about the population. Random assignment of individuals to groups permits inference about cause and effect. Figure 2.3.1 outlines all of the the possibilities:
Figure 2.3.1
| Were subjects randomly assigned? | Were subjects randomly selected? | Population | Cause & Effect |
|---|---|---|---|
| Yes | Yes | Yes (green) | Yes (green) |
| Yes | No | No (orange) | Yes (green) |
| No | Yes | Yes (green) | No (orange) |
| No | No | No (orange) | No (orange) |
The figure is explored in further detail in Interactive 2.3.1.
Interactive 2.3.1 Detailed Breakdown of Figure 2.3.1
Frame 1 of 5
Population → Sample; Sample → Treatment Groups. Callouts: Randomness, Relationship to Figure 2.3.1, Partiality, Observational Studies. Open full-size image S0188Frame 2 of 5
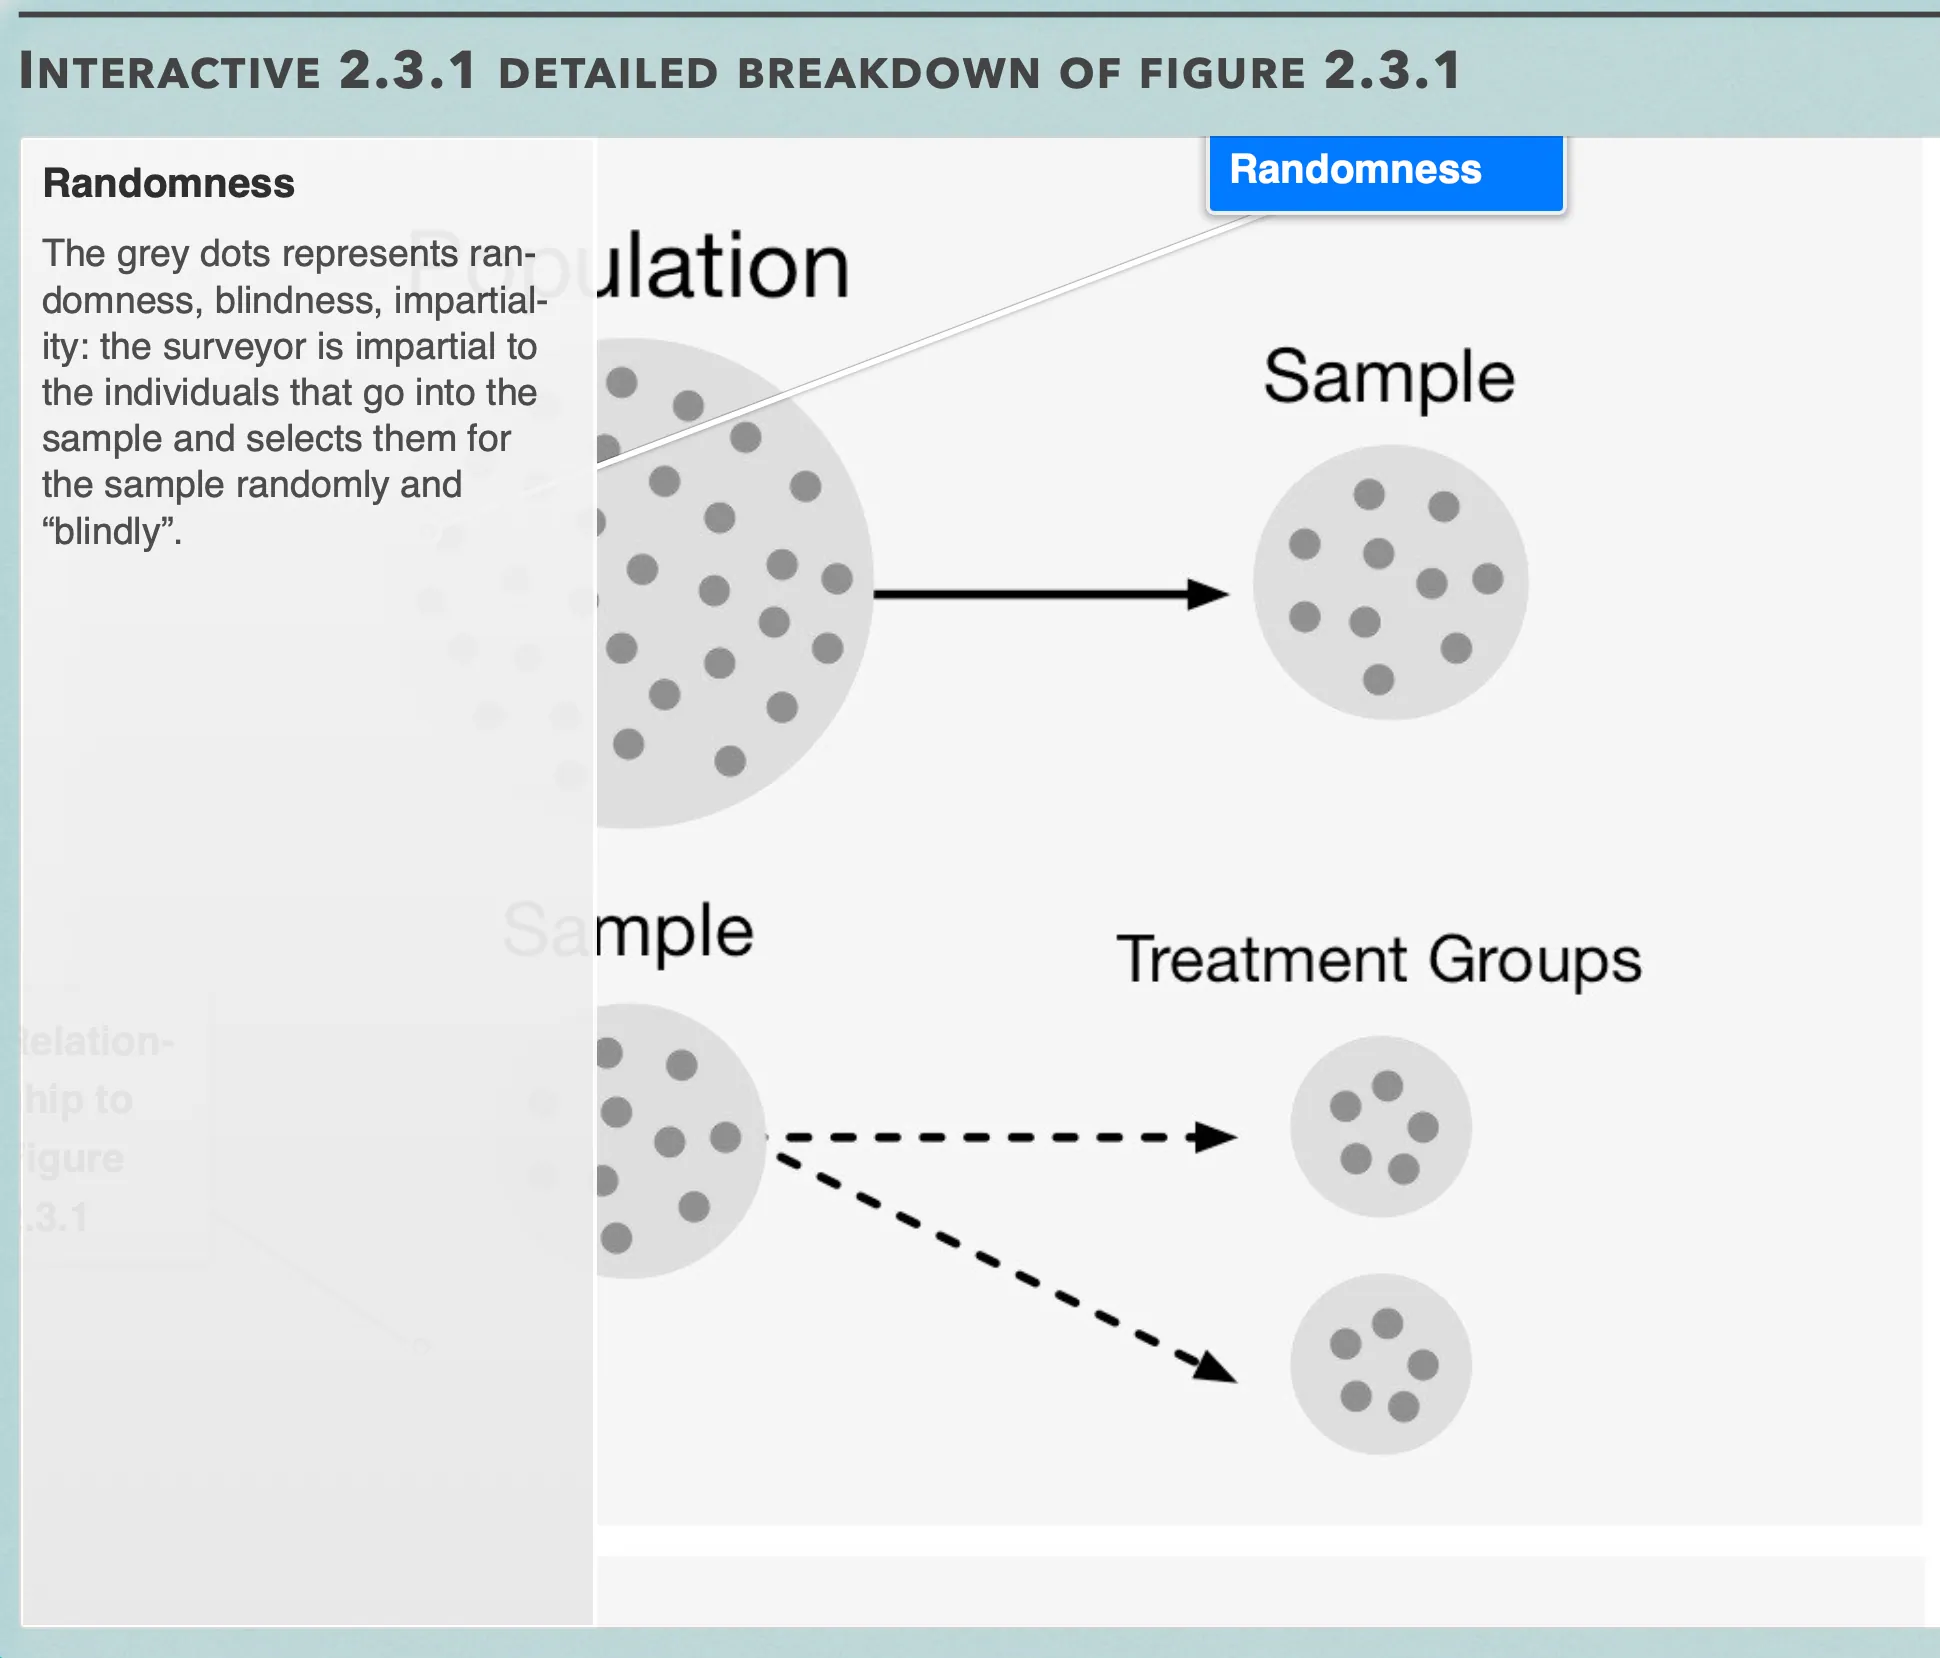
Randomness — The grey dots represents randomness, blindness, impartiality: the surveyor is impartial to the individuals that go into the sample and selects them for the sample randomly and “blindly”. Open full-size image S0189Frame 3 of 5
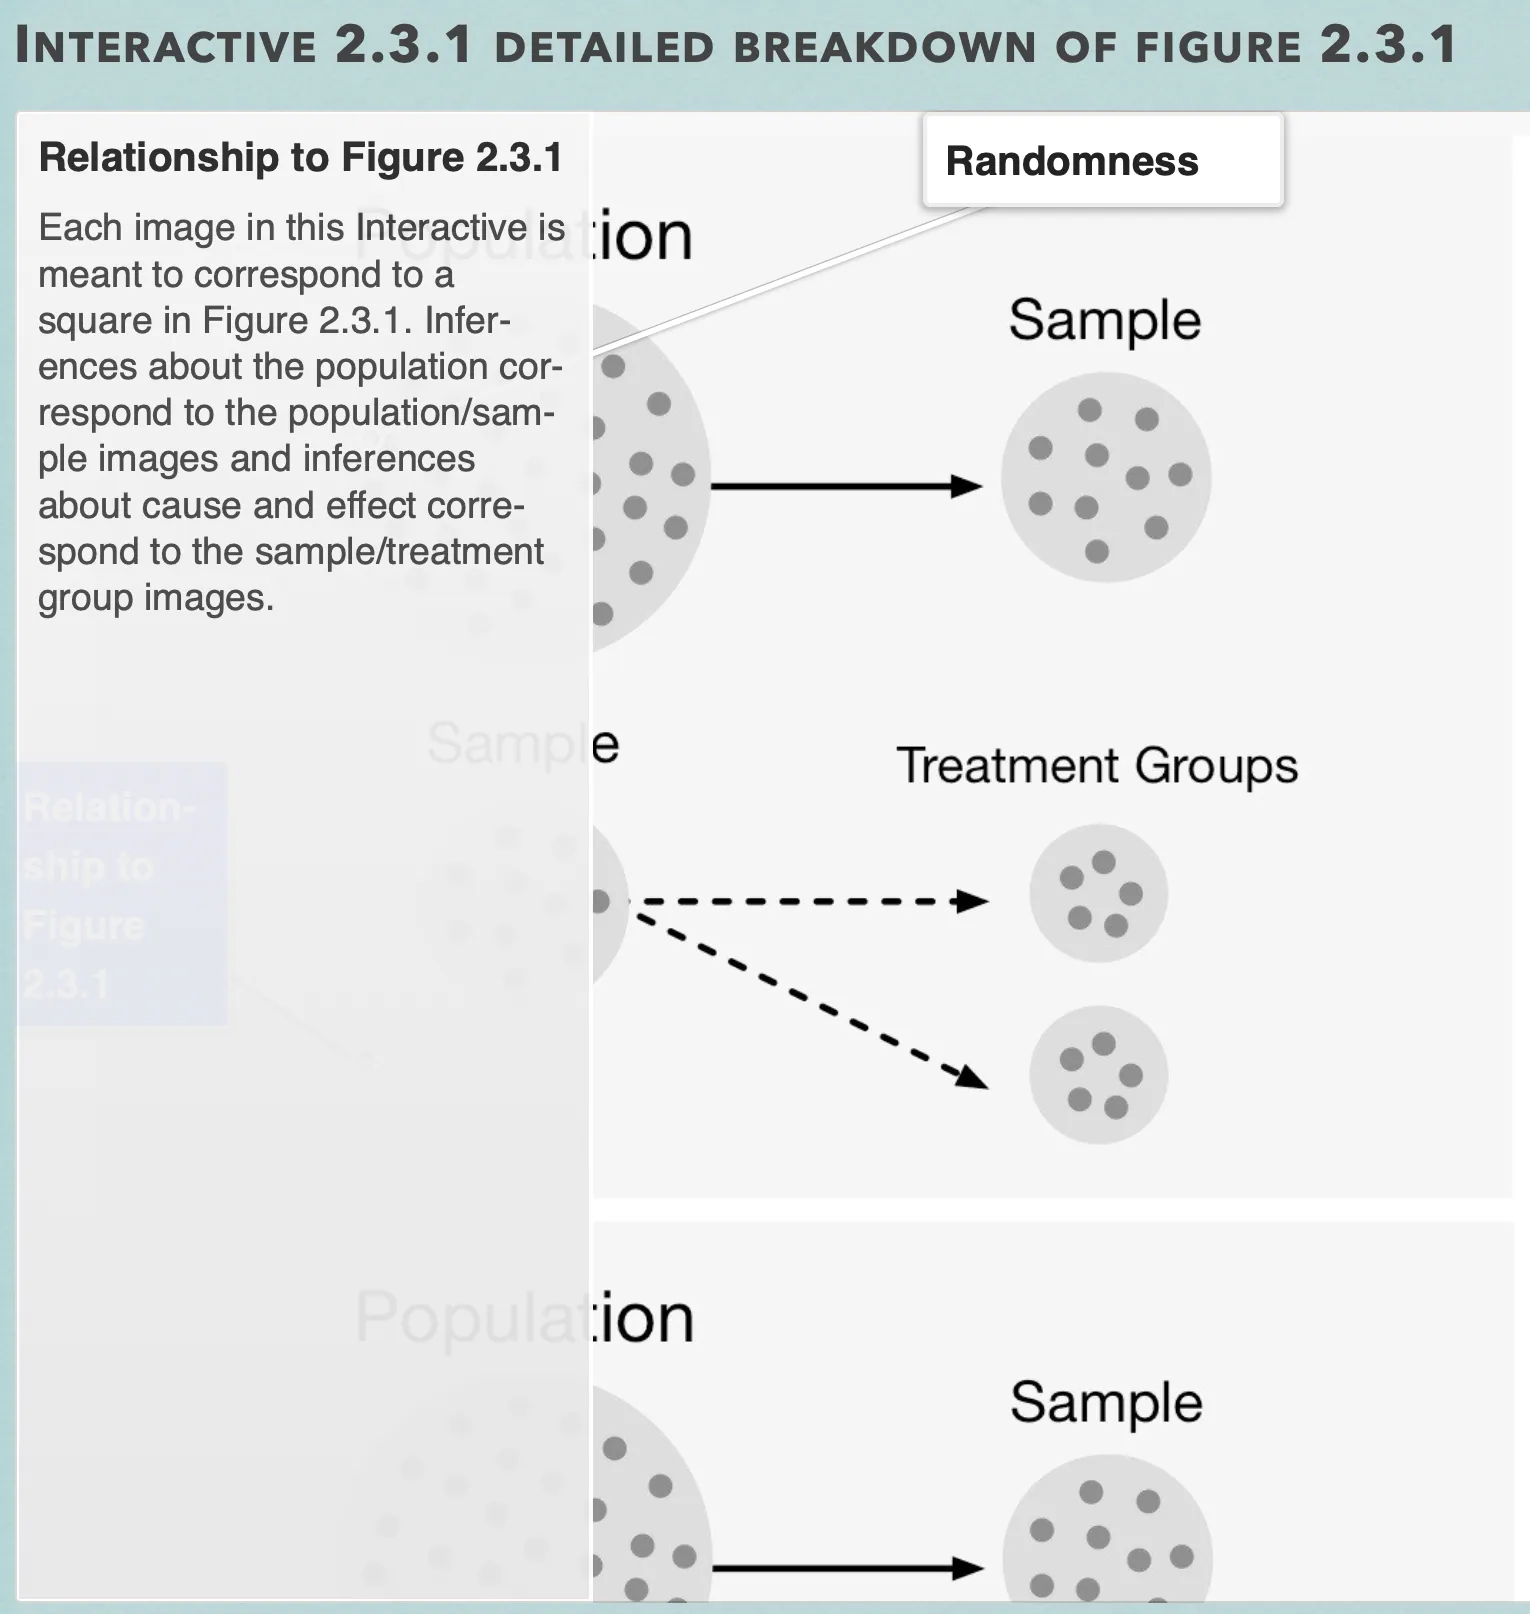
Relationship to Figure 2.3.1 — Each image in this Interactive is meant to correspond to a square in Figure 2.3.1. Inferences about the population correspond to the population/sample images and inferences about cause and effect correspond to the sample/treatment group images. Open full-size image S0190Frame 4 of 5
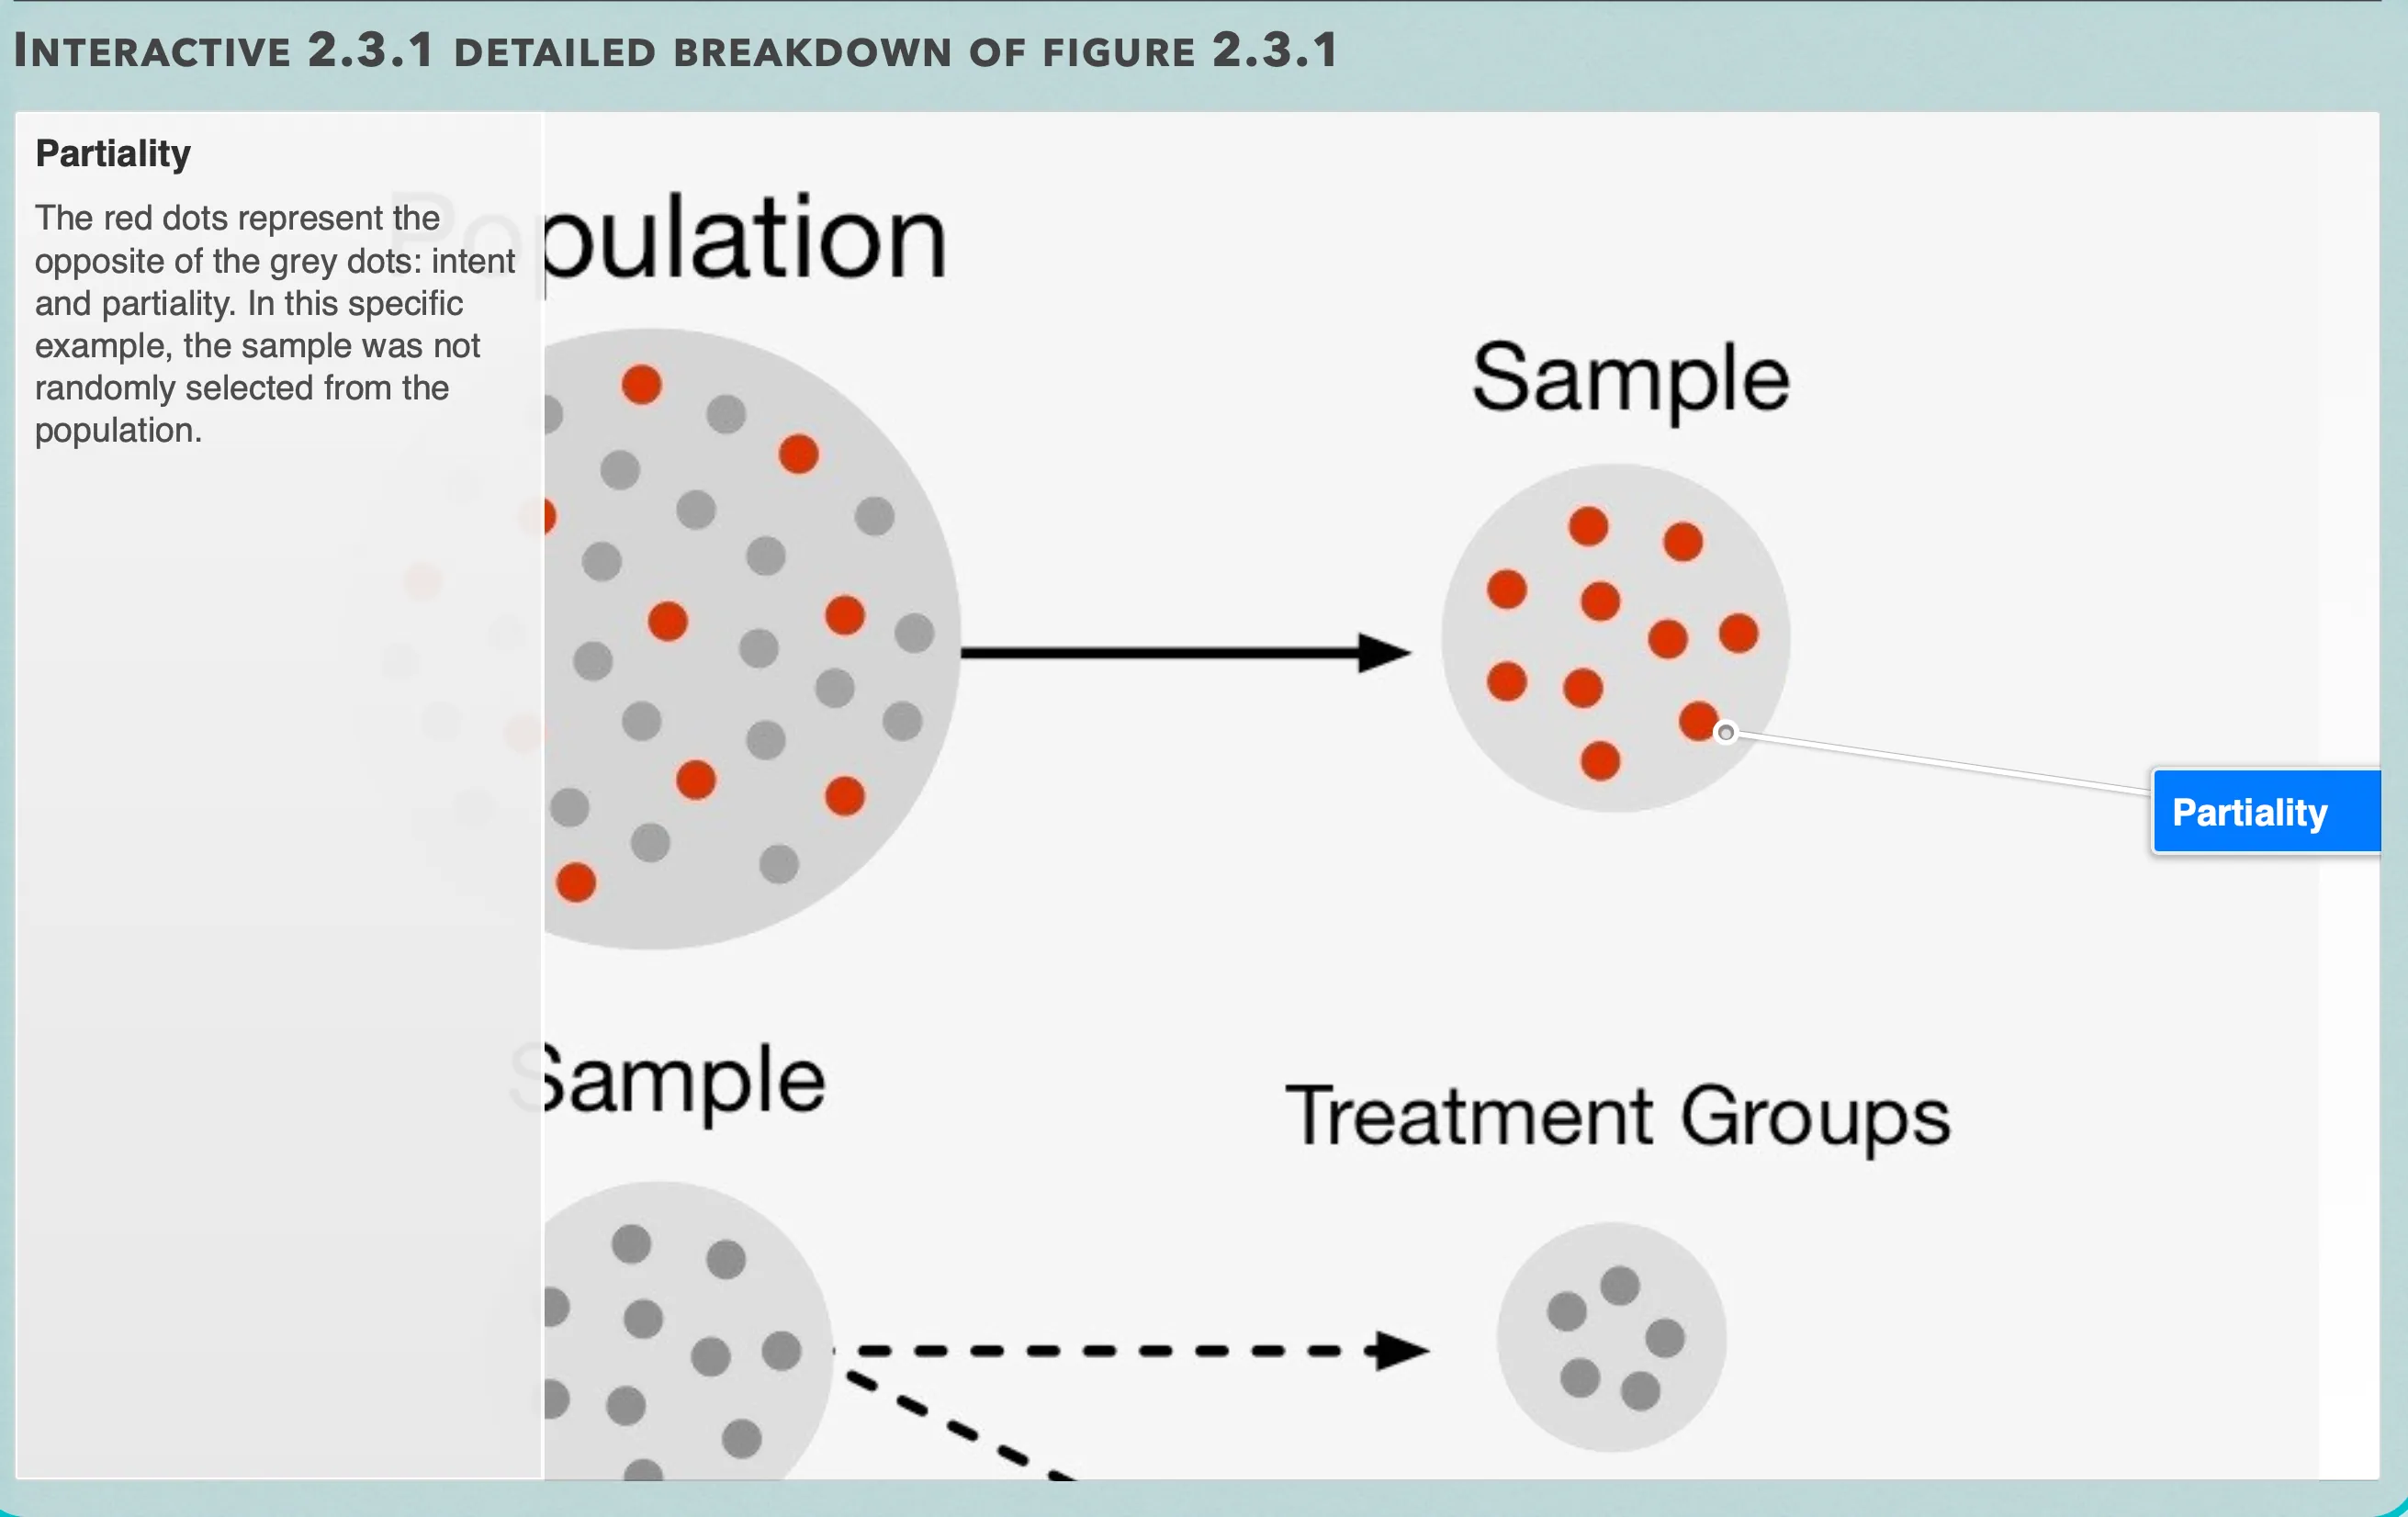
Partiality — The red dots represent the opposite of the grey dots: intent and partiality. In this specific example, the sample was not randomly selected from the population. Open full-size image S0191Frame 5 of 5
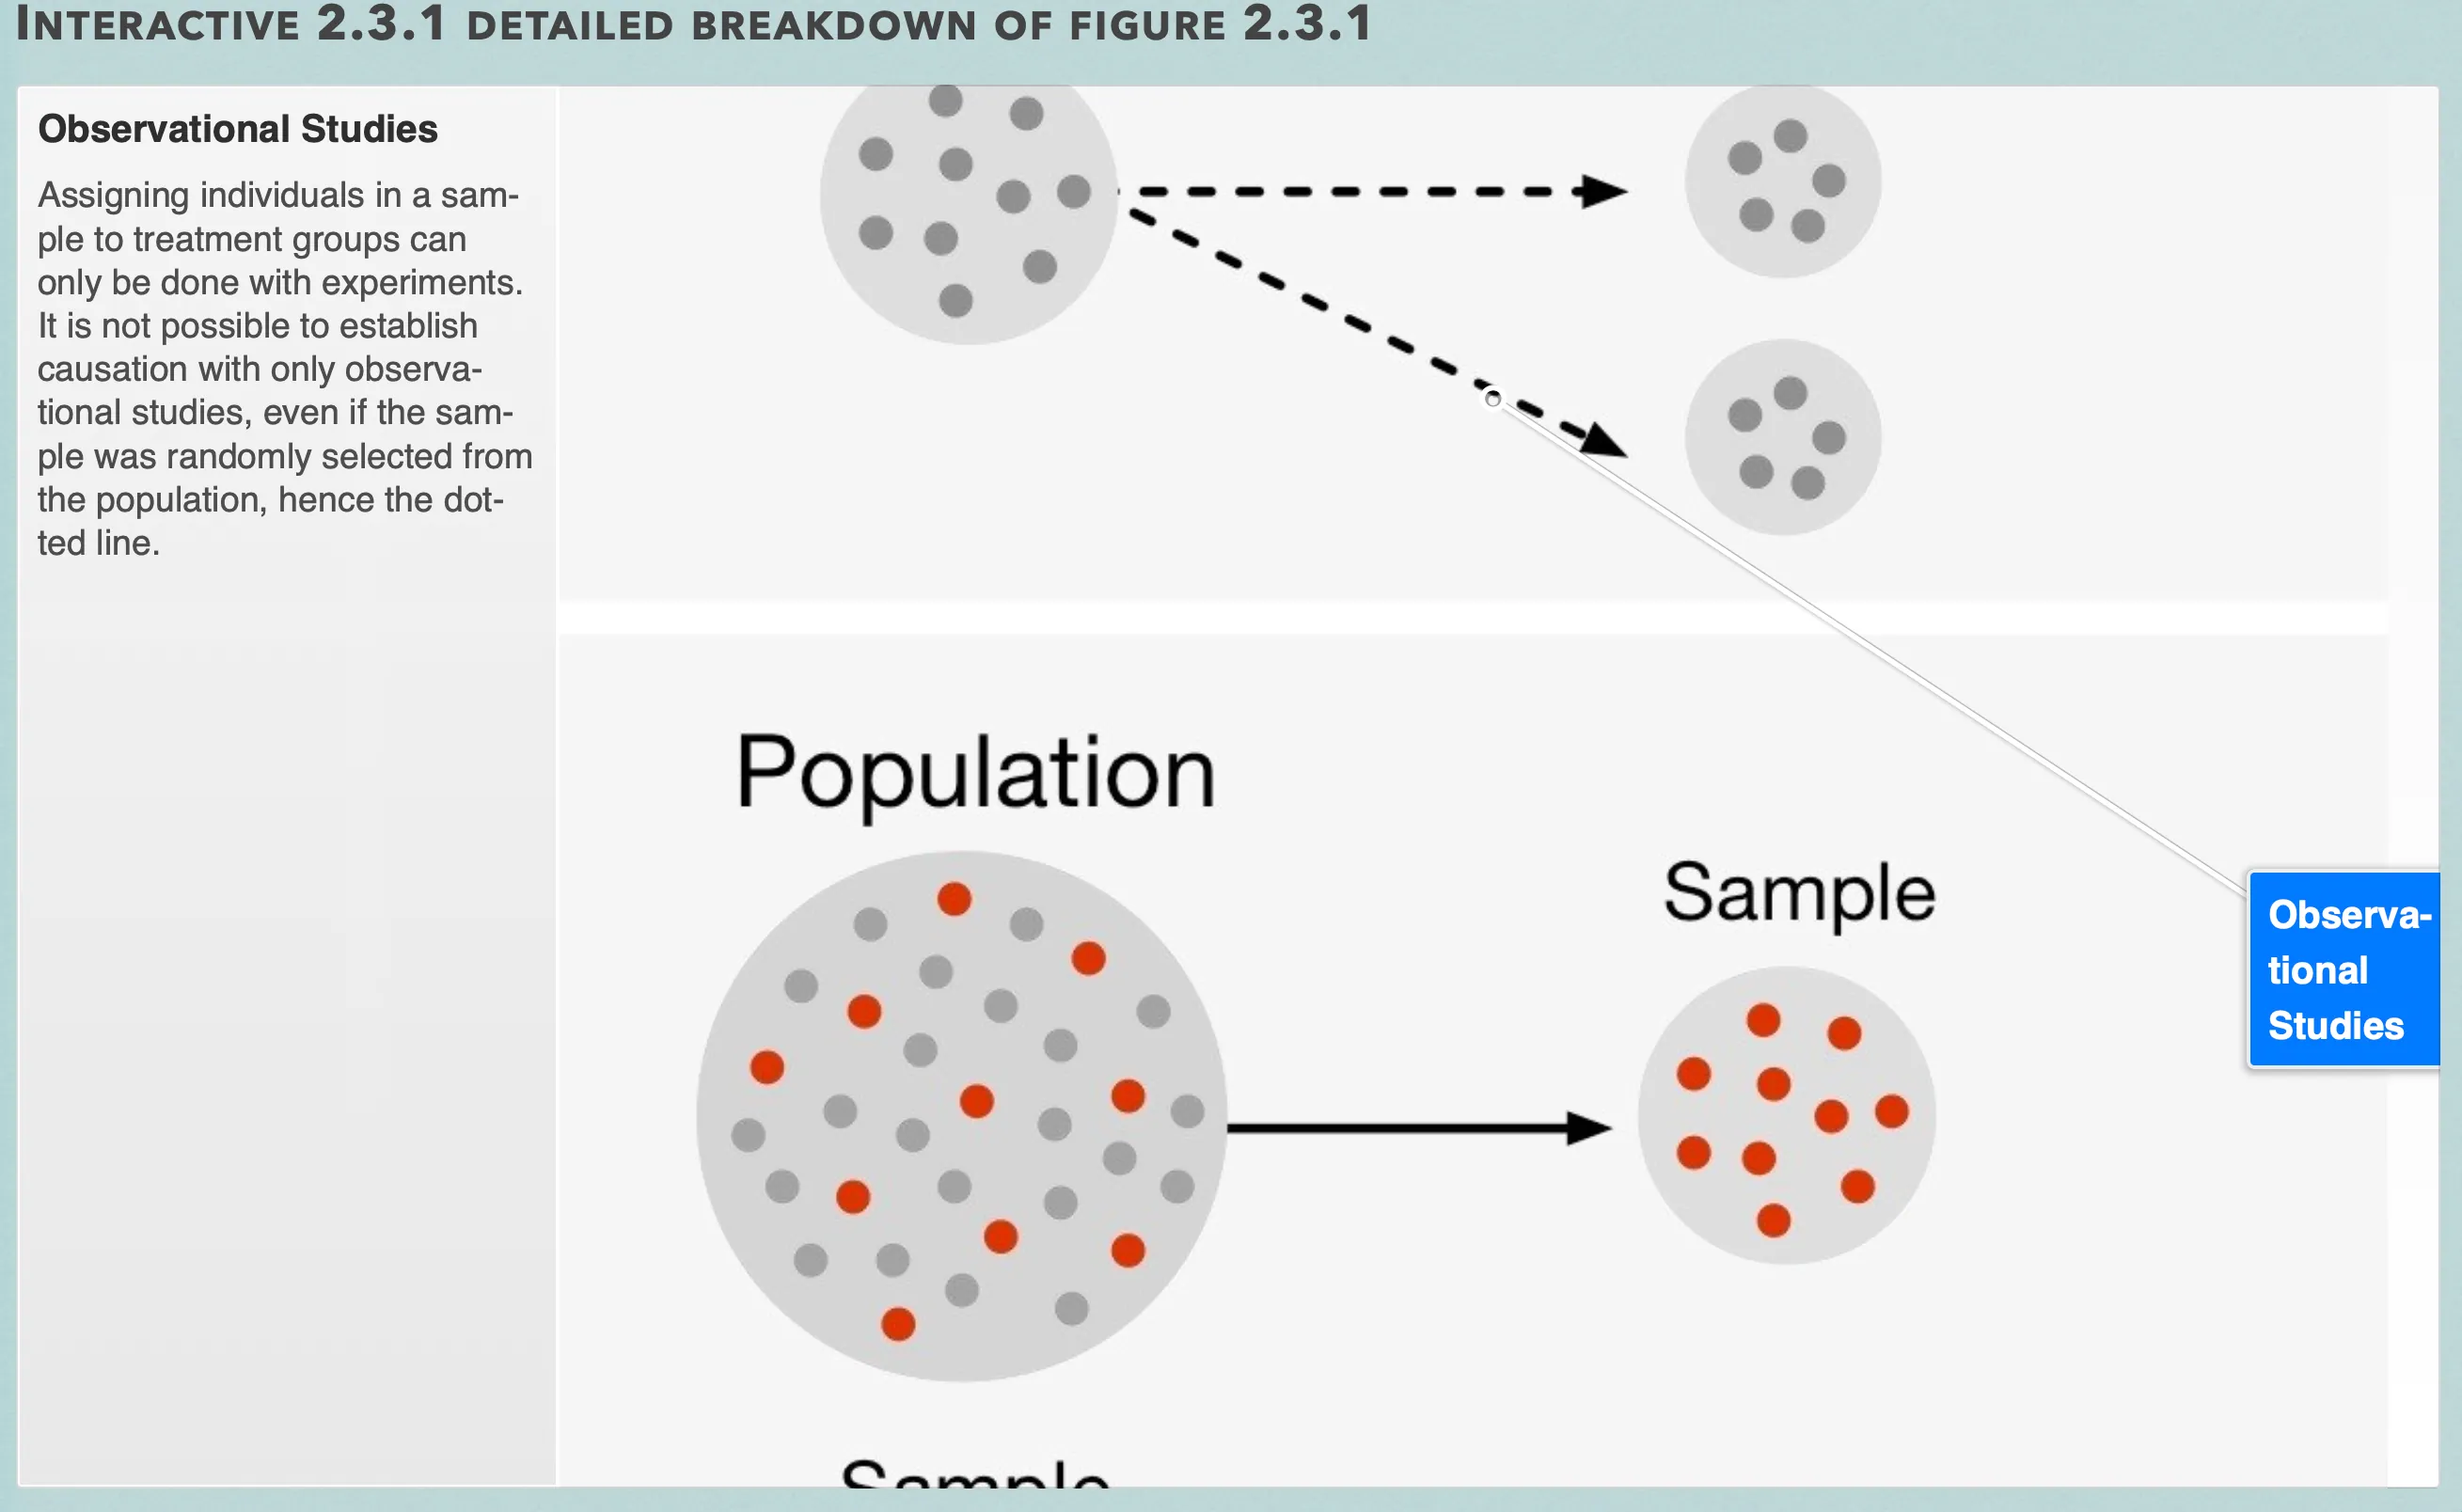
Observational Studies — Assigning individuals in a sample to treatment groups can only be done with experiments. It is not possible to establish causation with only observational studies, even if the sample was randomly selected from the population, hence the dotted line. Open full-size image S0192
Capture provenance
Filename capture times, with no recorded timezone. Frames above follow the original gallery positions.
- · S0188 · displayed frame 1
Screenshot 2026-10-05 at 3.49.55 PM.png - · S0189 · displayed frame 2
Screenshot 2026-10-05 at 3.50.03 PM.png - · S0190 · displayed frame 3
Screenshot 2026-10-05 at 3.50.12 PM.png - · S0191 · displayed frame 4
Screenshot 2026-10-05 at 3.50.19 PM.png - · S0192 · displayed frame 5
Screenshot 2026-10-05 at 3.50.24 PM.png
Example 2.3.1
Example 2.3.1 — Recorded answer
a) In this design, the individuals were not randomly selected, so no inference about the greater population can be made. Since no treatment was given, this was an observational study and thus no inference can be made about cause and effect, either. The stylist would only know that the people who got their hair cut at least once every two months had fewer split ends than people who didn’t, but not if the cut was actually the cause. See the square in the bottom right of Figure 2.3.1.
b) As in (a), the stylist cannot make any inference about the greater population because the individuals were not randomly selected. This time, however, subjects were randomly assigned to treatments, so the stylist can conclude that haircuts once every two months reduced split ends. This design would fall under the square in the top right of Figure 2.3.1.
c) In this design, the individuals were randomly selected, so the stylist can generalize the results to the greater population. As in (a), since no treatments were given to the subjects, this was an observational study and thus no inference can be made about cause and effect. This design would fall under the square in the bottom left of Figure 2.3.1.
d) As in (c), since the individuals were randomly selected, so the stylist can generalize the results to the greater population. And as in
treatments, the stylist can conclude that haircuts once every two months reduced split ends. This design would fall under the square in the top left of Figure 2.3.1.
The Difficulty in Establishing Causation
Making a strong case for causation is often difficult. Below are some criteria we use for establishing causation:
- The association between the explanatory variable and the response is strong
- The association shows a consistent pattern
- The cause precedes the effect in time
Example 2.3.2
Example 2.3.2 — Recorded answer
- The association between the explanatory variable and the response is strong - Studies have shown that long-term or heavy smokers get lung cancer more frequently than those that smoke less often and with fewer cigarettes. Those that decide to quit significantly reduce their risk of getting lung cancer.
- The association shows a consistent pattern - There have been countless studies over the years and throughout various countries. The results suggest that smoking is the most likely cause of lung cancer.
- The cause precedes the effect in time - It usually takes at least a few decades for smokers to get lung cancer.
Pop Quiz 2.3.1
Glossary and deeper reading · 3 refreshers
These editorial refreshers supplement the reading. Definitions and examples are added guidance; original source wording and recorded answers remain in their original context.
-
Random sampling
Random sampling uses a specified chance process to select individuals from a population. It supports population inference when the sampling frame and data collection are appropriate, but does not guarantee perfect balance or eliminate every source of bias. For example, a random-number generator can select student identifiers from an enrollment list.
Read more: Random sampling in the captured Statistics reading →
-
Population
A population is the full set of individuals or measurements a study aims to describe. It must be defined clearly before deciding whether a sample supports generalization. For example, all students enrolled in a particular school this year form a population.
-
Explanatory variable
An explanatory variable is used to predict or explain variation in a response variable. In an experiment, researchers deliberately assign values or treatments related to an explanatory variable. For example, assigned study time could be an explanatory variable when test score is the response.
Read more: Explanatory variable in the captured Statistics reading →