One Mean and Paired Differences: A Complete t Investigation
These lessons and problems are newly written for the revised course. Worked examples show complete reasoning; the application questions ask you to make and defend your own choices.
Why estimating variability changes the distribution
A population mean μ describes the typical value of a quantitative response over a named population. Usually population standard deviation σ is unknown, so sample s estimates it. Treating s as a known population quantity would understate the uncertainty in a standardized mean. Student’s t distributions provide the reference family for critical values and test statistics in these mean procedures.
The t family is symmetric, bell-shaped and standardized, with heavier tails and a lower peak than the standard normal, especially at small degrees of freedom. Its df parameter depends on sample size; for one sample it is n−1. As df increases, the t curve approaches the standard normal, whose mean is 0 and SD is 1. This shape change explains why a small sample uses a larger 95% critical multiplier than z*=1.96. A sample SD is not a standard error: the latter describes the estimated variation of the sample mean over repeated samples.
One sample can be a sample of differences
For one sample of a quantitative response with unknown σ, estimate μ with a one-sample t-interval and test it with a one-sample t-test. Define the response, units and population: for example, mean perfume longevity in hours for a focus-group population. A statement such as “the average lasts longer” without a population or unit leaves the parameter unclear.
A matched-pairs design measures two dependent responses on the same person or on matched units. Form one difference for each pair in a stated order, then analyze the one sample of differences. The parameter μ_d is the population mean of those ordered differences. One-sample t methods apply to μ_d, with sample mean x̄_d as point estimate. n counts pairs, not twice as many individual measurements. Differences can be stable even when the original columns vary widely; their SD, not a pooled SD of those columns, belongs in SE.
For the ordinary mean, H₀:μ=μ₀; alternatives μ<μ₀, μ>μ₀ or μ≠μ₀ answer less, more or different questions. For after-minus-before change, H₀:μ_d=0; alternatives μ_d<0, μ_d>0 or μ_d≠0. If you reverse the subtraction, the sign and directional interpretation reverse too. Paired before/after observations without randomized control do not automatically establish that an intervention caused the change. Random treatment assignment and random population selection provide different support.
Check the distribution you actually analyze
Both one-sample t intervals and tests require randomization: a random sample or a randomized experiment. When sampling without replacement, verify n≤10%N using the population of sampled people/units; for paired population sampling, use the number of pairs. Population sampling is different from randomized treatment assignment, so there is no without-replacement population fraction to apply merely because an experiment assigns treatments.
The sample-data condition has alternatives: a stated approximately Normal population, or n≥30, or, for n<30, a sample distribution free of strong skewness and outliers. For paired data this must refer to the differences: at least 30 differences gives the large-sample route; with fewer than 30, inspect the sample of differences for strong skewness and outliers. Do not inspect only the before and after columns. A random design cannot fix a severe small-sample shape problem. The course’s large-sample threshold supports the approximation, but extreme measurements still deserve practical inspection rather than a blanket claim that large n makes every model reliable.
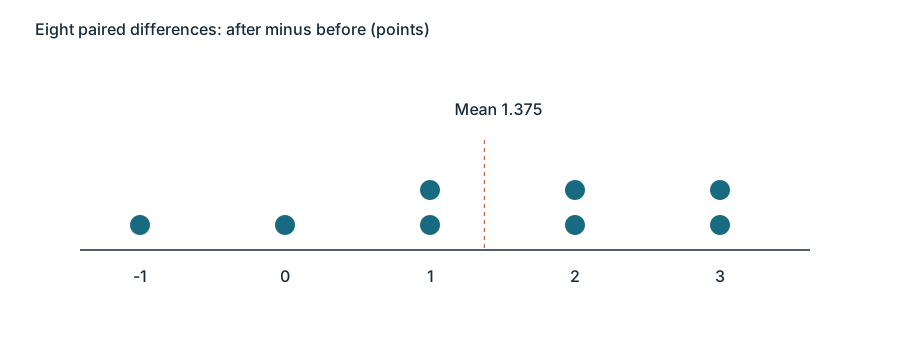
A new worked paired sample has eight after-minus-before changes: −1,0,1,1,2,2,3,3 points. Suppose an SRS of eight learners was selected from 2,000 learners. Randomization is given and 8≤200. The differences have no isolated extreme and a roughly balanced distribution; that supports the small-sample condition. Compare a sample −1,0,0,1,1,2,2,30: its isolated 30 undermines that condition even if its original columns happen to look harmless.
Compute the mean’s uncertainty and the t result
For the paired worked data, x̄_d=1.375 points, s_d≈1.407886 points, n=8. SE=s_d/√8≈0.497763 points. For an ordinary mean the same formulas use x̄ and s; x̄ or x̄_d is the appropriate point estimate. SE estimates variation of that mean across repeated samples, rather than the spread among individual differences.
Testing μ_d=0 against μ_d≠0 gives t=1.375/0.497763≈2.76236, df=7. Under the null, the statistic has a t₇ distribution; a table or technology gives the two-tail p≈0.0280006. For the central 95% t₇ area, t*=2.364624. The MOE is t*SE≈1.177022 points, so the confidence interval is (0.197978,2.552022) points.
For a separate one-mean worked sample, 16 generated perfume durations are 11.1,11.4,11.6,11.8,11.9,12.0,12.1,12.2,12.3,12.4,12.5,12.6,12.7,12.8,13.0,13.2 hours. Their mean is 12.225, s≈0.580230, SE≈0.145057. Against μ₀=12, t≈1.551109 with df15 and two-sided p≈0.141715. Using t*=2.131450 gives MOE≈0.309183 and 95% interval (11.915817,12.534183) hours. These newly supplied observations form a worked example; they do not complete missing historical stimuli or recover an unseen key.
Interpret probability, confidence and the investigative result
For the paired example, p≈0.0280 means: if the population mean after-minus-before change were zero, a sample of eight under this design would produce a standardized mean at least 2.76236 away from zero in absolute value with probability about 0.0280. Both tails are relevant to “change”; one upper tail is only half this two-sided probability. At α=0.05, p≤α gives reject H₀. There is convincing evidence of a population mean change among the sampled learner population, without proving a causal effect or claiming every learner improved.
We are 95% confident that the population mean after-minus-before change lies between 0.198 and 2.552 points. The endpoints are a lower and upper bound for the mean, not for individual changes. This entirely positive interval supports an increase in the population mean. The confidence level means that in repeated same-size samples from the same population, about 95% of intervals constructed this way contain the fixed μ_d. One computed interval either contains μ_d or does not; it is not correct to assign it a random population parameter.
For the separate perfume example, p≈0.1417>0.05 gives fail to reject μ=12. The interval includes 12, so it does not supply convincing two-sided evidence against that value. Neither result proves μ=12. A formal conclusion compares p with the preset α, names the parameter and population, follows the alternative, and uses limited evidence language. It is how the statistical result answers the original investigative question. A central 95% interval matches a two-sided 5% test; do not automatically reuse that match for a one-sided test.
Plan confidence and sample size together
For a fixed sample, increasing confidence requires a larger critical t*, which increases MOE and full interval width. At df24, 90% t*=1.710882 and 95% t*=2.063899. With n=25 and s=10 hours, SE=2; MOE rises from 3.421764 to 4.127798 hours, so the full width rises from 6.843528 to 8.255596 hours. Confidence buys a higher long-run capture rate by reporting a wider range.
Increasing n reduces SE when variability remains comparable. At fixed confidence, width is approximately proportional to 1/√n. Quadrupling n roughly halves the width; it does not quarter it. The relationship is approximate for t intervals because df and therefore t* also change. With n=100, s=10 and 95% t*=1.984217, SE=1 and width=3.968434, slightly less than half the n25 width. Decide which precision and confidence matter before choosing a sample-size target; higher confidence and smaller MOE cannot be obtained for free from the same data.
Independent Application
Work through each investigation before opening the separate solutions. State parameters, show calculations and connect your reasoning to the actual study.
Original generated practice for the Fall 2026 course.
Glossary and deeper reading · 21 refreshers
These editorial refreshers supplement the reading. Definitions and examples are added guidance; original source wording and recorded answers remain in their original context.
-
Mean
The mean is a measure of center often called an average. For a finite data set, the arithmetic mean is the sum of the values divided by their number; for a random variable, the mean is its probability-weighted expected value when that value exists. Means can be pulled toward extreme values and are not generally resistant. For example, the arithmetic mean of 2, 4, and 9 is 5.
-
Population
A population is the full set of individuals or measurements a study aims to describe. It must be defined clearly before deciding whether a sample supports generalization. For example, all students enrolled in a particular school this year form a population.
-
Symmetric distribution
A symmetric distribution has approximately matching shapes on either side of its center. Symmetry alone does not establish that a distribution is Normal. For example, a uniform distribution over a centered interval is symmetric but has a flat rather than bell-shaped density.
Read more: Symmetric distribution in the captured Statistics reading →
-
Degrees of freedom
Degrees of freedom describe the independent information remaining after constraints or estimated quantities are accounted for. The value depends on the procedure, rather than always being the sample size minus 1. For example, a one-sample t procedure uses n − 1 degrees of freedom, while simple regression inference uses n − 2.
Read more: Degrees of freedom in the captured Statistics reading →
-
Sample
A sample is the subset of a population actually studied. How it is selected matters for the conclusions that can be drawn about the population. For example, 60 selected students may be a sample from a school’s full enrollment.
-
One-sample t procedure
A one-sample t procedure makes inference about a population mean using the sample mean and sample standard deviation. It requires an appropriate study design and a sufficiently suitable distribution of the mean, with particular care for small samples, strong skewness, and outliers. For example, a random sample of travel times can estimate a population mean when the assumptions are defensible.
Read more: One-sample t procedure in the captured Statistics reading →
-
Matched pairs design
A matched pairs design compares two treatments within matched units or within the same unit. Assignment within pairs or treatment order is randomized when the design permits, and analysis uses the pairwise differences. For example, two shoe designs can be compared on the same person with their left-right assignment randomized.
Read more: Matched pairs design in the captured Statistics reading →
-
Population parameter
A population parameter is a numerical feature of the population or probability model being studied. It is fixed for that defined population, although its value may be unknown. For example, the true proportion of all enrolled students who walk to school is a parameter.
Read more: Population parameter in the captured Statistics reading →
-
Observation
An observation is a recorded value or set of values for an individual or occasion. The individual may be a person, object, or event rather than a human subject. For example, one plant’s measured height is an observation in a plant-growth study.
-
Treatment
A treatment is a specific condition imposed on an experimental unit. In a multifactor experiment, a treatment is a combination of factor levels. For example, low fertilizer with eight hours of light is one treatment combination.
-
Random sampling
Random sampling uses a specified chance process to select individuals from a population. It supports population inference when the sampling frame and data collection are appropriate, but does not guarantee perfect balance or eliminate every source of bias. For example, a random-number generator can select student identifiers from an enrollment list.
Read more: Random sampling in the captured Statistics reading →
-
Experiment
An experiment deliberately imposes treatments and measures responses. Random assignment, comparison, and replication help distinguish treatment effects from other variation. For example, assigning plants to fertilizer treatments is an experiment.
-
Skewness
Skewness describes asymmetry in a quantitative distribution’s tails. A longer right tail indicates right skew, while a longer left tail indicates left skew. For example, many short waits with a few very long waits produce right skew.
-
Outlier
An outlier is an observation unusually far from the overall pattern. The 1.5-IQR rule flags possible outliers below the first quartile minus 1.5 IQR or above the third quartile plus 1.5 IQR. For example, a very long commute may be flagged for investigation without automatically being a recording error.
-
Simple random sample
A simple random sample of a fixed size gives every possible subset of that size the same chance of selection. Giving individuals equal selection chances alone does not establish that the design is an SRS. For example, randomly choosing three identifiers without replacement from ten gives an SRS when every three-identifier set is equally likely.
Read more: Simple random sample in the captured Statistics reading →
-
Point estimate
A point estimate is the specific numerical value obtained from an estimator for the observed sample. It gives one estimate without expressing uncertainty by itself. For example, a sample mean of 14 minutes is a point estimate of the population’s mean travel time.
Read more: Point estimate in the captured Statistics reading →
-
Confidence interval
A confidence interval is a data-based range produced by a method with a specified long-run coverage rate for a population parameter. For a fixed population, the calculated interval either contains the parameter or it does not; the confidence level describes the method over repeated samples. For example, a 95% method captures the true parameter in about 95% of repeated intervals when its assumptions hold.
Read more: Confidence interval in the captured Statistics reading →
-
Probability
Probability quantifies how likely an event is under a specified chance model. It lies between 0 and 1, with larger values representing greater likelihood. For example, drawing a red card from a well-shuffled standard deck has probability one half.
-
Two-sided test
A two-sided test seeks evidence for departures in either direction from the null claim. For symmetric z or t tests, extreme evidence appears in both tails of the reference distribution. For example, a not-equal alternative asks whether a population mean is either lower or higher than a stated value.
Read more: Two-sided test in the captured Statistics reading →
-
Confidence level
A confidence level is the long-run fraction of intervals from a procedure that capture the true parameter under its assumptions. Holding the data and procedure fixed, increasing the confidence level generally widens the interval. For example, a 99% interval is usually wider than a 90% interval calculated from the same sample.
Read more: Confidence level in the captured Statistics reading →
-
One-sided test
A one-sided test seeks evidence for a specified direction of departure from the null claim. Its relevant extreme outcomes lie in one direction of the test statistic’s distribution. For example, a greater-than alternative asks whether a population mean exceeds a stated value.
Read more: One-sided test in the captured Statistics reading →