One Quantitative Variable: Histograms, Stems, and Dots
Quantitative graphs preserve the ordering of a measurement or count. A wait of 10 minutes belongs between 9 and 11, not at an arbitrary category position. Histograms, stem-and-leaf plots, and dotplots give different amounts of detail while keeping that natural order.
Three Ways to Keep the Order
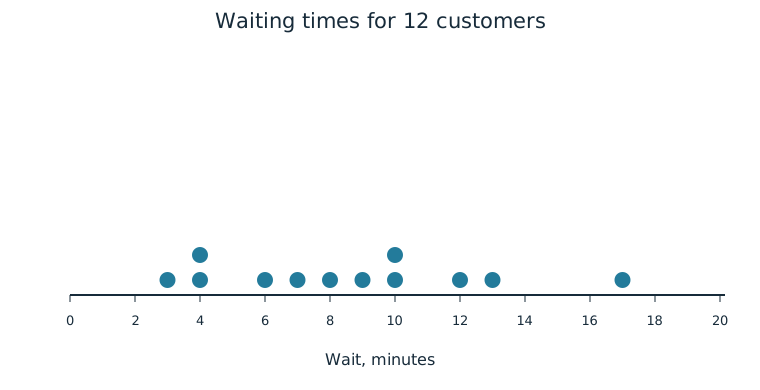
For twelve customers, waiting times in minutes are 3, 4, 4, 6, 7, 8, 9, 10, 10, 12, 13, and 17. Each graph describes the distribution of these quantitative values. Frequencies or relative frequencies tell us how many observations lie at a value or in an interval of values.
A histogram groups values into ordered intervals, or bins. With bins 0 to less than 5, 5 to less than 10, 10 to less than 15, and 15 to less than 20, the frequencies are 3, 4, 4, and 1. Each bar spans its numerical interval; the bars touch when the intervals touch. The horizontal axis gives the ordered measurement intervals and bar heights give frequency or relative frequency. A histogram can alternatively place the bins on the vertical axis with bars extending horizontally.
| Waiting-time interval | Frequency | Relative frequency |
|---|---|---|
| 0 to less than 5 minutes | 3 | 3/12 |
| 5 to less than 10 minutes | 4 | 4/12 |
| 10 to less than 15 minutes | 4 | 4/12 |
| 15 to less than 20 minutes | 1 | 1/12 |
The endpoint rule matters. A wait of exactly 10 minutes goes in the 10-to-less-than-15 bin, not the previous bin. State the rule so no observation is counted twice. Changing bin widths changes appearance: with 10-minute widths the same data have frequencies 7 and 5. Those wider bars hide some detail that the 5-minute bins show. An apparent peak may therefore depend partly on the grouping choice. For equal-width bins, the heights can directly represent counts or proportions as here.
A stem-and-leaf plot retains individual values. A stem supplies the first digit or digits and a leaf usually supplies the next single digit. Put stems in numerical order and sort leaves within each stem:
| Stem | Leaves |
|---|---|
| 0 | 3 4 4 6 7 8 9 |
| 1 | 0 0 2 3 7 |
Key: 1 | 7 means 17 minutes. The repeated leaves show repeated observations; they are not removed as duplicates. Both the stem and the key determine the units and place value. Without the key, 1 | 7 might be misunderstood as 1.7 minutes.
A dotplot places a dot at each observed quantitative value on the numerical axis. Identical or nearly identical values are stacked, with one dot for every observation. The axis can be horizontal with dots above it or vertical with dots beside it.
Worked Example: Recover Detail
The histogram tells us four customers waited between 10 and less than 15 minutes. It does not identify all four exact times. The stem-and-leaf plot and dotplot show two waits of 10, one of 12, and one of 13 minutes. Choose a representation based on how much detail the comparison needs, but check that every version accounts for all twelve customers in order.
Independent Practice
Use the information in each question to make your own calculation, representation, or argument. Explain what your result means in its setting.
Original generated practice for the Fall 2026 course.
Glossary and deeper reading · 5 refreshers
These editorial refreshers supplement the reading. Definitions and examples are added guidance; original source wording and recorded answers remain in their original context.
-
Histogram
A histogram groups quantitative observations into numerical intervals and displays their frequencies or proportions. Neighboring bars represent adjacent intervals, so the graph preserves numerical order. For example, a histogram can group travel times into ten-minute intervals.
-
Stemplot
A stemplot splits each numerical observation into a stem and a leaf. A key specifies the place values, so the original observations can be recovered. For example, a key of 3 | 7 = 37 means that stem 3 with leaf 7 represents 37.
-
Relative frequency
Relative frequency is a group’s count divided by the total count. It can be written as a proportion or multiplied by 100 to give a percentage. For example, 8 choices out of 20 have relative frequency 0.4, or 40%.
Read more: Relative frequency in the captured Statistics reading →
-
Observation
An observation is a recorded value or set of values for an individual or occasion. The individual may be a person, object, or event rather than a human subject. For example, one plant’s measured height is an observation in a plant-growth study.
-
Dotplot
A dotplot places a dot for each observation above its numerical value. Repeated values are usually shown by stacking dots. For example, three observations equal to 4 produce a stack of three dots above 4.