Describe a Quantitative Distribution in Context
A quantitative plot is more than a collection of dots or bars. A description should help someone imagine the pattern and understand what it means for the measured people or things. Start with shape, center, and variability, then call attention to features that would be missed by a single average.
Describe Shape, Center, and Spread
Shape concerns the overall pattern. A right-skewed, or positively skewed, distribution has a longer tail toward larger values than toward smaller values. A left-skewed, or negatively skewed, distribution has a longer tail toward smaller values. An approximately symmetric distribution has left and right halves that are roughly mirror images. Judge the tails, not merely which side contains the tallest bar.
A unimodal distribution has one main peak; bimodal has two prominent peaks. An approximately uniform distribution has frequencies or relative frequencies about the same across its values or intervals, without prominent peaks. A small bump is not automatically a meaningful second mode; the representation and overall pattern matter.
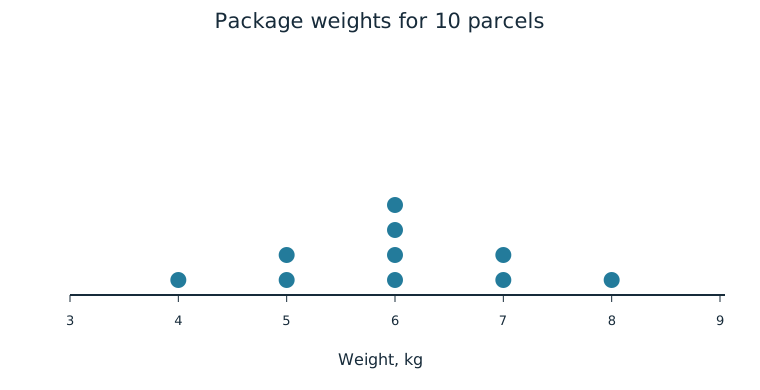
Describe a typical location as the center and the amount of variation as spread. For the parcel plot, a typical weight is around 6 kg and observed weights run from 4 to 8 kg. Both statements name the variable and units. A description saying “center 6 and spread 4” leaves a reader to guess what was measured and whether 4 means range, standard deviation, or something else.
Unusual features include outliers, unusually small or large values relative to the rest; gaps, intervals between values containing no observations; and clusters, concentrations of observations usually separated by gaps. A gap is not a missing record invented to make the graph smooth. It is a feature of the observed distribution. An isolated value can suggest a possible outlier before a formal numerical rule is applied.
Worked Example: Service Times
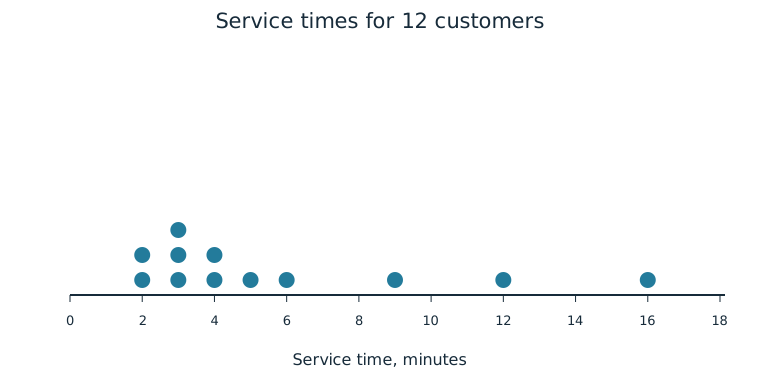
These sampled service times are right-skewed and have a main concentration around 2–4 minutes. Most waits are under 7 minutes, but observations extend to 16 minutes; the spread is substantial relative to a typical time. The long right tail makes “everyone was served quickly” a poor description. If a point seems isolated, say why it stands apart and whether it is only a possible outlier or has also met a stated numerical rule.
Justify With Visible Features
A plot can support a contextual claim when the claim follows from its features. To assess “parcel weights are roughly balanced around 6 kg,” point to the matched counts at equal distances from 6. To assess “no customer waited more than 10 minutes” in the service plot, the 12- and 16-minute observations refute it. Use numerical positions, counts, tails, or clusters as evidence.
Do not confuse a description of the observed sample with a claim about every future observation. A symmetric sample does not ensure the next parcel weighs 6 kg. A plotted association or shape also does not reveal the cause of that pattern. The graph makes the data visible; the argument must stay within what the data and study support.
Independent Practice
Use the information in each question to make your own calculation, representation, or argument. Explain what your result means in its setting.
Original generated practice for the Fall 2026 course.
Glossary and deeper reading · 9 refreshers
These editorial refreshers supplement the reading. Definitions and examples are added guidance; original source wording and recorded answers remain in their original context.
-
Right-skewed distribution
A right-skewed distribution has a longer tail toward larger values. Most observations may lie toward the lower end while a few large values extend the right tail. For example, waiting times can be right-skewed when most waits are short and a few are very long.
Read more: Right-skewed distribution in the captured Statistics reading →
-
Left-skewed distribution
A left-skewed distribution has a longer tail toward smaller values. Most observations may lie toward the higher end while a few small values extend the left tail. For example, scores on an easy test can be left-skewed when most scores are high.
Read more: Left-skewed distribution in the captured Statistics reading →
-
Bimodal distribution
A bimodal distribution has two main peaks. Two peaks can suggest different groups, but the graph alone does not establish their cause. For example, combining commute times from nearby and distant neighborhoods may produce two peaks.
Read more: Bimodal distribution in the captured Statistics reading →
-
Relative frequency
Relative frequency is a group’s count divided by the total count. It can be written as a proportion or multiplied by 100 to give a percentage. For example, 8 choices out of 20 have relative frequency 0.4, or 40%.
Read more: Relative frequency in the captured Statistics reading →
-
Standard deviation
Standard deviation measures spread around the mean using squared deviations and a square root. A sample standard deviation uses the sum of squared deviations divided by one less than the sample size before taking the square root. For example, a larger standard deviation of travel times indicates greater variability, in the original time units.
Read more: Standard deviation in the captured Statistics reading →
-
Outlier
An outlier is an observation unusually far from the overall pattern. The 1.5-IQR rule flags possible outliers below the first quartile minus 1.5 IQR or above the third quartile plus 1.5 IQR. For example, a very long commute may be flagged for investigation without automatically being a recording error.
-
Observation
An observation is a recorded value or set of values for an individual or occasion. The individual may be a person, object, or event rather than a human subject. For example, one plant’s measured height is an observation in a plant-growth study.
-
Sample
A sample is the subset of a population actually studied. How it is selected matters for the conclusions that can be drawn about the population. For example, 60 selected students may be a sample from a school’s full enrollment.
-
Symmetric distribution
A symmetric distribution has approximately matching shapes on either side of its center. Symmetry alone does not establish that a distribution is Normal. For example, a uniform distribution over a centered interval is symmetric but has a flat rather than bell-shaped density.
Read more: Symmetric distribution in the captured Statistics reading →