One Categorical Variable: Bar and Pie Charts
A graph should let a reader see the category information without guessing the units or denominator. Bar and pie charts represent the same one-variable distribution in different ways. Choosing a graph does not change which observations belong to the sample.
Construct Bar and Pie Charts
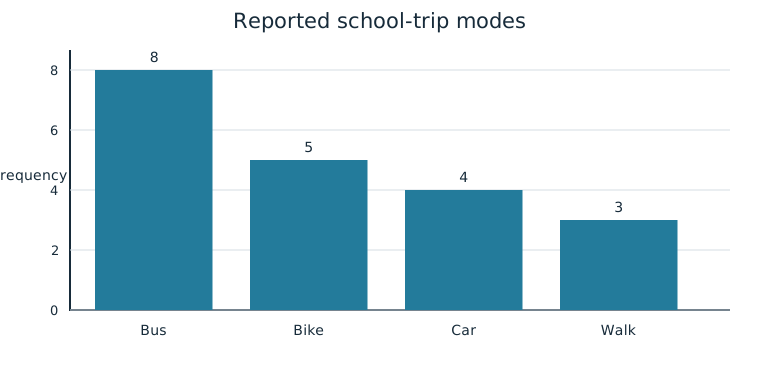
A bar chart, also called a bar graph, uses one bar per category. The bar’s height or length represents its frequency, a count, or its relative frequency, a proportion. Label the categories and the numerical scale. Separate bars because the categories are distinct; their ordering does not represent a continuous measurement scale. Use a zero baseline so lengths faithfully show the values.
Consider 20 school-trip reports: bus 8, bike 5, car 4, and walk 3. A frequency bar chart has heights 8, 5, 4, and 3 students. A relative-frequency chart uses 0.40, 0.25, 0.20, and 0.15. The tallest category stays bus in either chart.
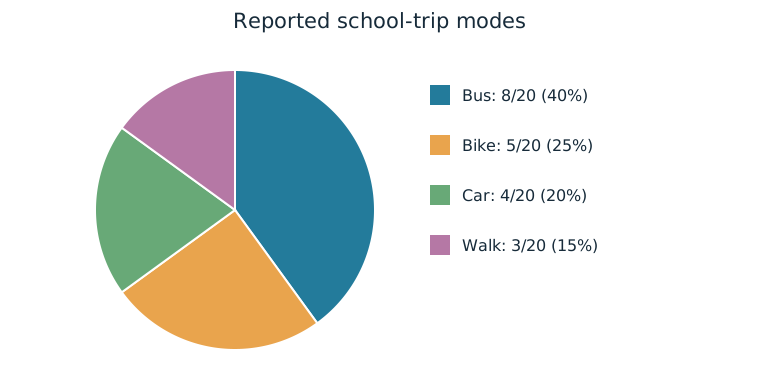
A pie chart uses one slice per category. A slice’s area as a fraction of the whole represents the relative frequency. All slices together must equal one complete circle, or 100% of its area. For a hand construction, multiply each category proportion by 360 degrees: bus 144°, bike 90°, car 72°, walk 54°. The angles sum to 360°. Use the same circle for every category and label its shares; decorative three-dimensional perspectives can make the displayed areas misleading.
Worked Example: Construction Checks
The bike bar has height 5 students, and the bike slice occupies 5/20=25% of the circle. Drawing five equally sized slices for five bike students while using one slice for each other category would not follow the category-area rule. Similarly, a bar labeled “5%” would confuse its frequency with its percentage. Check which quantity the graph’s scale actually represents.
Justify a Graphical Claim
Graphs reveal information that can support claims in context. The figures show bus as the most common single mode because its bar is tallest and its slice largest. They also show that bus is not a majority: its 40% slice is less than half the circle. To justify a claim, identify the relevant category values and explain the comparison. A graph’s attractive appearance is not evidence.
Compare Categorical Distributions
Use frequency or relative frequency tables, bar charts, and pie charts to compare two or more data sets for the same categorical variable. Keep category definitions consistent. If sample sizes differ, compare relative frequencies for shares; otherwise the bigger sample may have taller count bars merely because more people were observed.
Worked Example: A Second Neighborhood
A second sample of 40 students reports bus 12, bike 8, car 8, and walk 12. Its bus count is larger than 8, but its bus share is 12/40=30%, below the first sample’s 40%. Its walk share is 30%, compared with 15% in the first sample. Side-by-side relative-frequency bars or two labeled pies display those differences. A useful comparison is “Walking makes up twice the share in the second sampled neighborhood.” It concerns these samples and this variable; it does not establish why neighborhoods differ.
Independent Practice
Use the information in each question to make your own calculation, representation, or argument. Explain what your result means in its setting.
Original generated practice for the Fall 2026 course.
Glossary and deeper reading · 5 refreshers
These editorial refreshers supplement the reading. Definitions and examples are added guidance; original source wording and recorded answers remain in their original context.
-
Pie chart
A pie chart displays category proportions as slices of a circle. A slice’s angle is proportional to its category’s share of the whole. For example, a category containing one quarter of the observations occupies one quarter of the circle.
-
Observation
An observation is a recorded value or set of values for an individual or occasion. The individual may be a person, object, or event rather than a human subject. For example, one plant’s measured height is an observation in a plant-growth study.
-
Bar graph
A bar graph uses separate bars to compare category counts or proportions. The bar lengths or heights encode the values, and category order need not be numerical. For example, separate bars can compare the number of votes for three lunch options.
-
Relative frequency
Relative frequency is a group’s count divided by the total count. It can be written as a proportion or multiplied by 100 to give a percentage. For example, 8 choices out of 20 have relative frequency 0.4, or 40%.
Read more: Relative frequency in the captured Statistics reading →
-
Categorical variable
A categorical variable records a group or label for each individual. Numeric labels still count as categories when arithmetic on them has no meaningful interpretation. For example, favorite school subject is categorical, even if each subject receives a numbered code.
Read more: Categorical variable in the captured Statistics reading →