One Categorical Variable: Bar and Pie Charts — Worked Solutions
Worked Solutions
Compare your reasoning with the worked solutions after attempting the questions. A different valid representation or explanation can earn credit when it satisfies the stated criteria.
Original generated practice for the Fall 2026 course. Return to the lesson and independent checks.
What is the bar measuring?: worked answer
Six of 24 sampled customers choose tea.
Part a
Construct the tea bar in both a frequency and relative-frequency chart: label its category, numerical axis, baseline, and endpoint.
Frequency version: category Tea, count axis in customers beginning at 0, bar endpoint 6. Relative-frequency version: Tea, proportion axis beginning at 0, endpoint 6/24=0.25.
| Evidence for credit | Points |
|---|---|
| Both correctly labeled constructions and endpoints. | 1 |
A quarter of the whole: worked answer
A survey of 40 households records 10 whose main heating type is electric.
Part a
Construct the electric slice of a pie chart, stating its fraction of area and angle. State the total-area condition for the full pie.
Electric occupies 10/40=1/4=25% of the circle, with a 90° sector. The full set of category slices must sum to one circle, 100% of area, and 360°.
| Evidence for credit | Points |
|---|---|
| Quarter-area/90° construction. | 1 |
| Complete-circle total condition. | 1 |
Largest is not half: worked answer
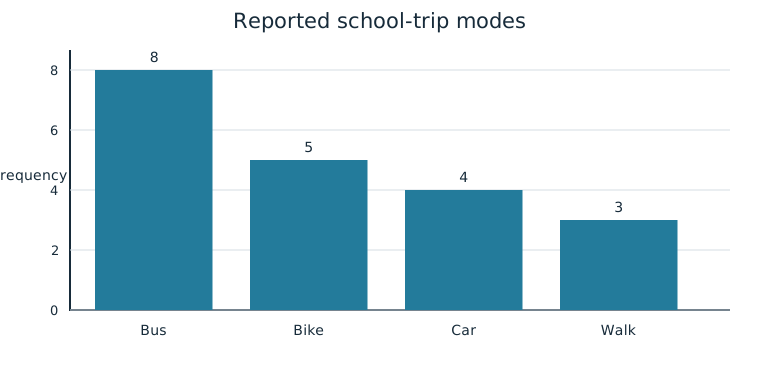
Part a
Justify or reject “more than half of the sampled students use a bus.” Cite graphical values.
Reject it: the bus bar is 8 of 20, or 40%, below half. It is the largest single category but that does not make it a majority.
| Evidence for credit | Points |
|---|---|
| Correct graphical count/proportion and comparison to half. | 1 |
Same category, different sample sizes: worked answer
| Sample | Bus | Bike | Car | Walk | Total |
|---|---|---|---|---|---|
| A | 8 | 5 | 4 | 3 | 20 |
| B | 12 | 8 | 8 | 12 | 40 |
Part a
Compare the bus and walk shares in the two distributions. Explain a graph choice that makes the comparison fair.
Bus: A 40%, B 30%. Walk: A 15%, B 30%. Relative-frequency bars with the same scale, or equally sized labeled pies, compare shares fairly despite different sample sizes.
| Evidence for credit | Points |
|---|---|
| Two correct contextual comparisons. | 1 |
| Appropriate common-share graphical representation. | 1 |
Construct and compare library-use graphs: worked answer
| Main purpose | North branch | South branch |
|---|---|---|
| Borrow books | 18 | 12 |
| Study | 12 | 24 |
| Use computers | 6 | 18 |
| Attend event | 4 | 6 |
| Total | 40 | 60 |
Part a
Construct North branch frequency and relative-frequency bar charts on paper. Label every category, scale, and axis; provide all bar endpoints with your response.
North count endpoints are 18,12,6,4 visitors. Relative-frequency endpoints are 0.45,0.30,0.15,0.10. Both charts use labeled categories, a zero numerical baseline, and count or proportion units matching the values.
| Evidence for credit | Points |
|---|---|
| All four count bars and proportion bars. | 1 |
| Categories, zero baseline, and correct units/scales. | 1 |
Part b
Construct a North branch pie chart. Give each slice percentage and central angle and check the whole.
Borrow 45%/162°, Study 30%/108°, Computers 15%/54°, Event 10%/36°. The shares sum to 100% and angles to 360°. Draw sectors proportional to these areas in one circle and label the categories.
| Evidence for credit | Points |
|---|---|
| All proportional sectors/labels. | 1 |
| Checks 100% and 360° totals. | 1 |
Part c
Use your graphical representations to justify whether borrowing is a majority and whether computers plus events account for one-quarter of North visitors.
Borrowing is 45%, so not a majority. Computers plus events are 15%+10%=25%, one-quarter. The bar sums or slice areas supply the evidence for these sample claims.
| Evidence for credit | Points |
|---|---|
| Both claims with actual bar/slice values. | 1 |
| Correct contextual visitor scope. | 1 |
Part d
Construct a South relative-frequency representation and compare the two distributions. Include all category shares and two contextual differences.
South shares are borrowing 20%, study 40%, computers 30%, event 10%. Compared with North 45%,30%,15%,10%, South has a smaller borrowing share, larger study and computer shares, and equal event share. A common-scale relative-frequency bar chart or labeled pie is valid.
| Evidence for credit | Points |
|---|---|
| Complete South shares and valid graphical representation. | 1 |
| At least two correct same-variable comparisons with both sample denominators. | 1 |