Correlation: Linear Strength, Direction, and Limits — Worked Solutions
Worked Solutions
Compare your reasoning with the worked solutions after attempting the questions. A different valid representation or explanation can earn credit when it satisfies the stated criteria.
Original generated practice for the Fall 2026 course. Return to the lesson and independent checks.
Compare signs and strengths: worked answer
An analyst reports r=−0.91 for distance from a lamp versus light reading, and r=0.54 for practice time versus target score.
Part a
Interpret both correlations in context and determine which has the stronger linear association. Explain your comparison.
Distance and light reading have a strong negative linear association: greater distance tends to accompany smaller readings. Practice time and target score have a moderate positive linear association: greater practice tends to accompany higher scores. The lamp relationship is stronger because |−0.91|=0.91 is closer to 1 than 0.54.
| Evidence for credit | Points |
|---|---|
| Interprets both directions in their correct contexts. | 1 |
| Compares magnitude rather than signed ordering. | 1 |
| States linear association rather than an unspecified relationship. | 1 |
A coefficient cannot have meters: worked answer
The same varying distance and light-reading observations are analyzed first with distance in meters and then in centimeters. The first output is r=−0.72. A second report prints r=−1.08 meters.
Part a
State the correlation after the positive unit conversion and explain why “−1.08 meters” cannot be a valid correlation. Include the allowed range and its endpoint convention.
The correlation remains −0.72 because a positive unit conversion does not change this unit-free summary of linear association. “−1.08 meters” is invalid both because correlation has no units and because −1.08 falls outside the inclusive interval [−1,1]. The endpoints −1 and 1 themselves are allowed.
| Evidence for credit | Points |
|---|---|
| Keeps r unchanged under the positive unit conversion. | 1 |
| States that r is unit-free. | 1 |
| States −1≤r≤1, inclusive, and rejects the invalid value. | 1 |
Zero and perfect correlations: worked answer
For 80 measured library visits, both the number of books borrowed and visit duration in minutes vary. A complete calculation reports exactly r=0 for those two quantitative variables; no scatterplot is supplied. Separately, generated data set L contains (1,9),(2,7),(3,5),(4,3), with r=−1. Both variables vary in L.
Part a
Interpret r=0 for the library visits and r=−1 for L. Does the zero report establish that books borrowed and visit duration have no relationship of any form? Explain what remains possible when no plot is supplied. What would r=1 mean for a data set with both variables varying?
For these 80 visits, r=0 indicates no linear association between number of books borrowed and visit duration. It does not establish that there is no relationship of any form: a non-linear relationship may exist, but without a plot the report does not show that one actually does. L has perfect negative linear association, with all points on a descending straight line. r=1 would mean perfect positive linear association, with all points on an ascending straight line, when both variables vary.
| Evidence for credit | Points |
|---|---|
| Interprets the library report as no linear association, explains that a non-linear relationship remains possible, and avoids claiming an unseen particular curve. | 1 |
| Interprets r=−1 as perfect negative linear association. | 1 |
| Interprets r=1 as perfect positive linear association. | 1 |
An impressive number on a curve: worked answer
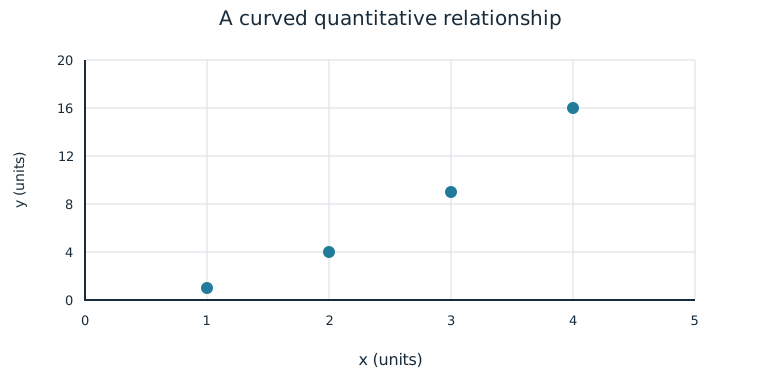
The generated pairs are (1,1),(2,4),(3,9),(4,16). Their correlation is r≈0.9844.
Part a
A student says, “r is so close to 1 that a linear model must be appropriate.” Evaluate the reasoning using the scatterplot.
The reasoning is not sufficient. r≈0.9844 describes a high positive linear correlation, but the points trace an upward curve. A coefficient near 1 does not guarantee a straight-line form; the systematic bending must be considered when choosing a model.
| Evidence for credit | Points |
|---|---|
| Acknowledges the high positive correlation. | 1 |
| Uses the observed curvature to challenge guaranteed linear appropriateness. | 1 |
| States the limitation without incorrectly claiming r is invalid. | 1 |
Warm days at the park: worked answer
Across 40 observed park days, ice cream sales and bicycle rentals have r=0.87. Neither quantity was assigned by researchers; warmer and busier days tend to have more of both.
Part a
Does the result establish that increasing ice cream sales causes more bicycle rentals? Interpret what r supports and give a context-specific alternative explanation.
No. It supports a positive linear association between sales and rentals in these observed days, subject to the plot’s form. Warm weather or more visitors could increase both quantities. The correlation does not establish that changing ice cream sales would cause rentals to change.
| Evidence for credit | Points |
|---|---|
| Rejects the causal claim from observational correlation. | 1 |
| States the supported positive linear association. | 1 |
| Gives temperature or visitor count as a specific alternative explanation. | 1 |
Review three quantitative reports: worked answer
Three generated reports analyze varying numerical variables. Report A: weekly practice hours and target scores, r=0.82, with a roughly straight upward scatterplot and noticeable scatter. Report B: distance from a lamp and light reading, r=−0.96, with a roughly straight downward pattern. Report C: x and y with full pairs (1,1),(2,4),(3,9),(4,16), r≈0.9844. Practice hours in A were chosen by members, not assigned.
Part a
Interpret the sign and linear strength of A and B, compare their linear strengths, and state whether changing A’s hours to minutes would give r units or change its value.
A shows a positive linear association between practice hours and scores; B shows a stronger negative linear association between distance and light reading because 0.96 is closer to 1 than 0.82. Multiplying hours by 60 leaves A’s correlation 0.82 and unit-free.
| Evidence for credit | Points |
|---|---|
| Correctly interprets both contextual signs and linear strengths. | 1 |
| Compares absolute magnitudes. | 1 |
| Preserves r=0.82 and unit-free status under the positive conversion. | 1 |
Part b
Report C has the largest positive r. Explain why that fact does not establish that its straight-line model is the best form.
The complete plot bends upward, following the exact squared relationship. Although r≈0.9844 is near 1, a high coefficient does not guarantee that a linear model is appropriate. A model decision must account for the curved form, not rank models solely by positive r.
| Evidence for credit | Points |
|---|---|
| Identifies curvature in C. | 1 |
| Explains the high-r limitation for choosing a linear form. | 1 |
Part c
A club advertises, “Our correlation proves that forcing members to practice longer causes higher target scores.” Evaluate that statement and name one plausible common cause in this setting.
The advertisement overstates the study. A’s r=0.82 supports positive linear association in the observed members, not the effect of forcing additional practice. Prior skill or motivation could influence both chosen practice time and score. A causal conclusion requires an appropriate design; r alone does not establish it.
| Evidence for credit | Points |
|---|---|
| Rejects the unsupported causal conclusion. | 1 |
| Keeps association distinct from the unperformed intervention. | 1 |
| Gives a plausible setting-specific common cause. | 1 |
Evaluate a coating-station report: worked answer
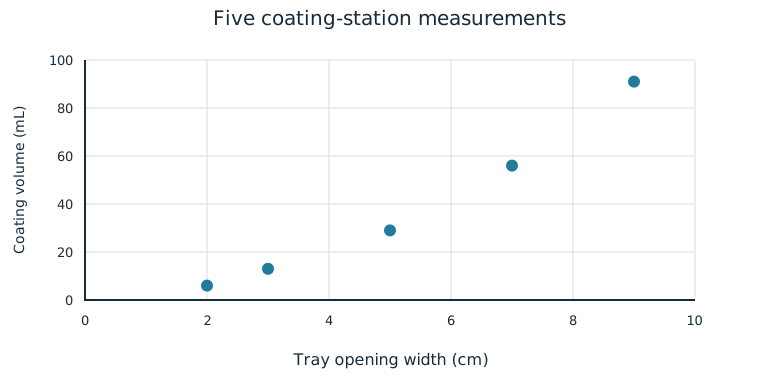
A workshop records tray opening width and dispensed coating volume in five generated production trials. The width is used to explain the volume. All five observations are supplied below; the calculated correlation is r≈0.9845.
| Trial | Tray opening width (cm) | Coating volume (mL) |
|---|---|---|
| 1 | 2 | 6 |
| 2 | 3 | 13 |
| 3 | 5 | 29 |
| 4 | 7 | 56 |
| 5 | 9 | 91 |
Part a
Describe the scatterplot’s form, direction, strength and unusual features in this setting. Cite numerical changes or point positions that justify your description. Do not decide the form from r alone.
For these five trials, larger tray openings accompany larger coating volumes in a strong positive, non-linear pattern that bends upward. All points follow a smooth rising path with no separate cluster or visibly isolated observation. Increases per centimetre are not roughly constant: successive rates are 7, 8, 13.5 and 17.5 mL per cm as the widths increase. That increasing rate supports an upward curve rather than a straight-line form. Strength concerns the close adherence to the pattern, not merely its steepness.
| Evidence for credit | Points |
|---|---|
| States a non-linear upward-bending form in the width/volume setting with specific point or rate evidence. | 1 |
| States positive direction and strong adherence to the pattern, keeping strength distinct from form/slope. | 1 |
| Addresses the absence of a separate cluster or isolated point in this five-trial stimulus. | 1 |
Part b
An analyst says, “Because 0.9845 is nearly 1, we can choose a straight-line model without inspecting the plot.” Evaluate that claim. Explain both what this near-endpoint r measures and why it does or does not settle the model-form choice.
r≈0.9845 indicates a strong positive linear correlation for these observations. It is a valid numerical summary, but proximity to 1 does not guarantee that a linear model is appropriate. The systematic upward bend in the complete plot would be missed by choosing only from the coefficient. Model form must account for that observed curvature; a high r alone does not settle the choice. The data do not make r invalid or prove a particular causal mechanism.
| Evidence for credit | Points |
|---|---|
| Interprets the near-1 value as strong positive linear correlation. | 1 |
| Uses the systematic bend in this new complete plot to reject guaranteed straight-line appropriateness. | 1 |
| Separates the coefficient’s meaning from a model-form guarantee, without calling r invalid or inventing causation. | 1 |