Scatterplots: Preserve, Describe, and Defend the Pattern — Worked Solutions
Worked Solutions
Compare your reasoning with the worked solutions after attempting the questions. A different valid representation or explanation can earn credit when it satisfies the stated criteria.
Original generated practice for the Fall 2026 course. Return to the lesson and independent checks.
Two measurements, one student: worked answer
A club records each member’s weekly practice time in hours and target score in points. Member R has the pair (3,18).
Part a
Identify the two quantitative variables, what one ordered pair represents, and which variable belongs on each axis if practice time is used to predict score. Explain why matching the hours of one member with another member’s score would be invalid.
The variables are weekly practice time (hours) and target score (points). The pair (3,18) belongs to one member: 3 hours and 18 points. Practice time is explanatory x on the horizontal axis; score is response y on the vertical axis. Mixing members destroys the observed pairing.
| Evidence for credit | Points |
|---|---|
| Identifies both variables and the same-member pairing. | 1 |
| Places explanatory time on x and response score on y with units. | 1 |
| Explains why cross-member re-pairing changes the observations. | 1 |
Place every observed pair: worked answer
Four generated observations are (x,y)=(1,7),(2,6),(3,4),(4,3), where x is distance from a lamp in meters and y is light reading in instrument units.
Part a
Construct a scatterplot of all four pairs. Label axes and units, use consistent scales, and show four distinct points. Describe the direction of the pattern.
A valid plot places distance (meters) on the horizontal axis and light reading (instrument units) on the vertical axis, includes (1,7),(2,6),(3,4),(4,3), and uses consistent scales. The pattern is negative because readings tend to fall as distance increases.
| Evidence for credit | Points |
|---|---|
| Constructs four correctly located paired points. | 1 |
| Labels variables/units and uses consistent scales. | 1 |
| Describes negative direction in context. | 1 |
Strong does not mean straight: worked answer
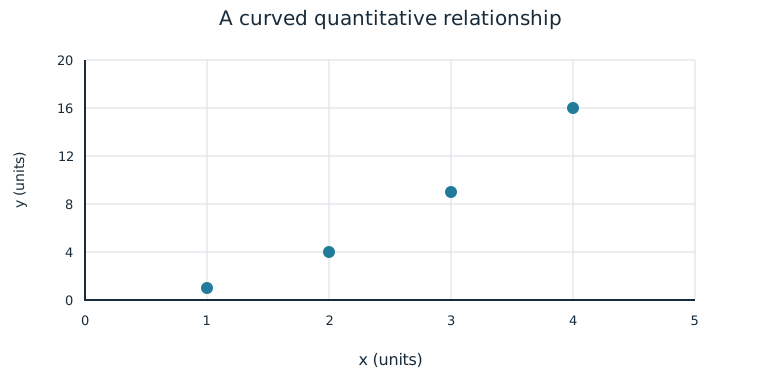
The complete generated pairs are (1,1),(2,4),(3,9),(4,16).
Part a
Describe the form, direction, strength, and unusual features of this scatterplot. Explain why “strong positive linear” is an incomplete or inaccurate description.
The association is strong, positive, and non-linear: y rises increasingly quickly as x increases, tracing an upward curve. No isolated point or separate cluster is evident. The points closely follow a curve, so “linear” misstates the form despite the strength.
| Evidence for credit | Points |
|---|---|
| Identifies non-linear curved form. | 1 |
| States positive direction and strong adherence to the curve. | 1 |
| Addresses unusual features and explains the linear-form error. | 1 |
A claim about the observed students: worked answer
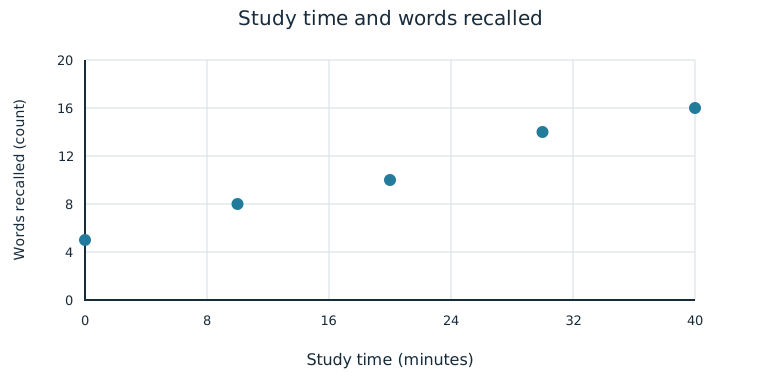
Five students have the pairs (study minutes, words recalled)=(0,5),(10,8),(20,10),(30,14),(40,16).
Part a
Justify or reject this claim: “In this observed group, longer study times are associated with larger recall counts.” Cite the plotted pattern and at least two numerical pairs.
The claim is supported: the points follow an upward pattern. For example, 10 study minutes accompanies 8 recalled words and 30 minutes accompanies 14, with the other three pairs also increasing in recall as study time increases. The claim concerns this observed association; it does not establish causation.
| Evidence for credit | Points |
|---|---|
| States support for a positive association in the observed group. | 1 |
| Uses the overall pattern and two correct paired observations. | 1 |
| Keeps the conclusion within the claim’s observational scope. | 1 |
Practice time, clusters, and an exception: worked answer
A coach observes seven club members. Practice time is used to explain score; no practice times were randomly assigned. The generated data below are complete.
| Member | Practice (hours) | Target score (points) |
|---|---|---|
| 1 | 1 | 12 |
| 2 | 2 | 14 |
| 3 | 3 | 16 |
| 4 | 8 | 26 |
| 5 | 9 | 28 |
| 6 | 10 | 30 |
| 7 | 2 | 29 |
Part a
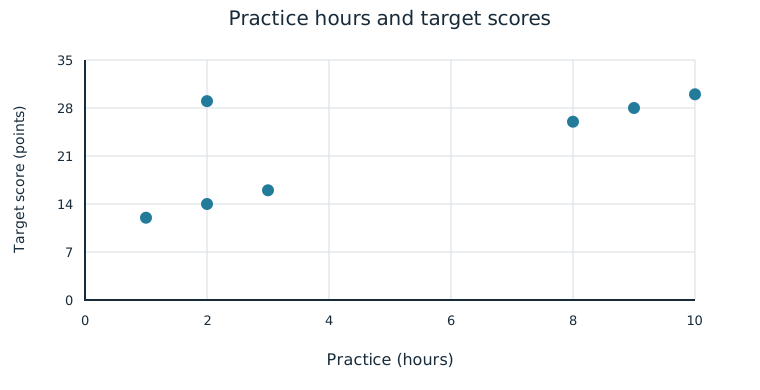
Construct a scatterplot from the seven paired observations. Label both axes with their variables and units, choose consistent scales including all observations, and plot every member.
A valid scatterplot has practice hours on x and score points on y, consistent scales including x=1 through 10 and y=12 through 30, and points (1,12),(2,14),(3,16),(8,26),(9,28),(10,30),(2,29). The two x=2 observations are separate points at 14 and 29.
| Evidence for credit | Points |
|---|---|
| Uses correctly labeled explanatory/response axes and units. | 1 |
| Plots all seven paired observations, including both x=2 points. | 1 |
| Uses consistent scales without losing any observation. | 1 |
Part b
Describe form, direction, and strength. Identify the two main clusters and the unusual observation, and explain how that observation affects your description.
Most points follow a positive, approximately linear pattern. There are low-practice points near 1–3 hours with scores 12–16 and high-practice points near 8–10 hours with scores 26–30. The member at (2,29) is unusually high compared with the other low-practice members. The main pattern is close to linear, but this unusual point weakens the overall adherence; a supported “moderate” or “fairly strong with one unusual point” description is acceptable.
| Evidence for credit | Points |
|---|---|
| Describes positive, approximately linear main pattern. | 1 |
| Identifies both numerical clusters and (2,29) as unusual. | 1 |
| Relates strength to closeness and qualifies it because of the exception. | 1 |
Part c
Justify or reject each claim using the plotted evidence: (i) the high-practice cluster generally has higher scores; (ii) every member practicing fewer than 4 hours scores fewer than 20 points.
Claim (i) is supported: members at 8–10 hours score 26–30, compared with 12–16 for three of the four members at 1–3 hours. Claim (ii) is false because the point (2,29) has fewer than 4 practice hours and more than 20 points. The exception matters to “every,” even though the general cluster comparison remains useful.
| Evidence for credit | Points |
|---|---|
| Supports the general cluster claim with correct ranges. | 1 |
| Rejects the universal claim using the exact counterexample. | 1 |
| Distinguishes an overall tendency from a rule for every individual. | 1 |