Testing a Proportion: What Would Happen Under the Null?
These lessons and problems are newly written for the revised course. Worked examples show complete reasoning; the application questions ask you to make and defend your own choices.
Start with a population question
Suppose a city says 40% of residents carry a reusable bottle. A sample can easily produce a proportion above 40% even when the population proportion is exactly 40%. A hypothesis test asks whether the observed difference is ordinary sampling variation under the stated population value or convincing evidence of another value. We need a probability model for the statistic, not a probability that a hypothesis is true.
Let p mean the proportion of all city residents who carry a bottle. This definition names the population and response, rather than silently substituting the sample proportion. The appropriate procedure for one binary response in one representative sample is a one-sample z-test for a population proportion. A null hypothesis H₀ is a statement about this population parameter assumed for the calculation. The alternative Hₐ describes the claim for which evidence is being collected. For “more than 40%,” write H₀:p=0.40 and Hₐ:p>0.40. “Less than” uses <; “different from” uses ≠ and requires both tails.
A null can express an equality reference as =, ≥ or ≤. A claim of “at least 40%” can be opposed by p<0.40; in AP Statistics the one-sided null is tested at the boundary p=0.40. Never write a hypothesis about p̂: that number is observed, whereas p is the unknown population value. Choose the alternative from the research question before using the data to select a favorable tail.
Build the model from the design
Three conditions support the normal approximation. First, observations should come from a random sample; a voluntary poll does not acquire this property merely because it is large. Second, for sampling without replacement, n must be at most 10% of population size N. This keeps the finite-population dependence small enough for the usual calculation. Third, the null expected counts np₀ and n(1−p₀) must both be at least 10. A test models repeated samples assuming H₀, so p₀ belongs here. An interval estimates an unknown population proportion and instead checks observed counts using p̂.
For a new worked example, an SRS of 160 residents from 10,000 includes 76 bottle carriers. Test H₀:p=0.40 against p>0.40. Random selection is given; 160≤1,000 verifies the sampling fraction; expected successes 64 and failures 96 meet the count condition. The point estimate is 76/160=0.475. Under H₀ the sampling standard deviation is √[0.40(0.60)/160]=0.038730. The observed proportion is about 1.9365 null standard deviations above the target.
The null z-statistic is approximately standard normal. A table or normal-distribution technology gives P(Z≥1.9365)≈0.0264. The theoretical curve is an approximation to the distribution of repeated statistics under p=0.40; the design/count checks explain why using it is reasonable. If a required condition fails, acknowledge the limit rather than proceeding because a calculator produces a number.
Use the alternative to decide what is extreme
A p-value is the probability, assuming the null hypothesis is true, of a statistic as extreme or more extreme than the observed result in the alternative’s direction. For observed standardized x, a greater alternative uses P(Z≥x); a less alternative uses P(Z≤x). A two-sided alternative uses P(Z≤−|x|)+P(Z≥|x|). On a symmetric theoretical normal curve the two tails are equal. A plot showing only one tail does not show an entire two-sided p-value.
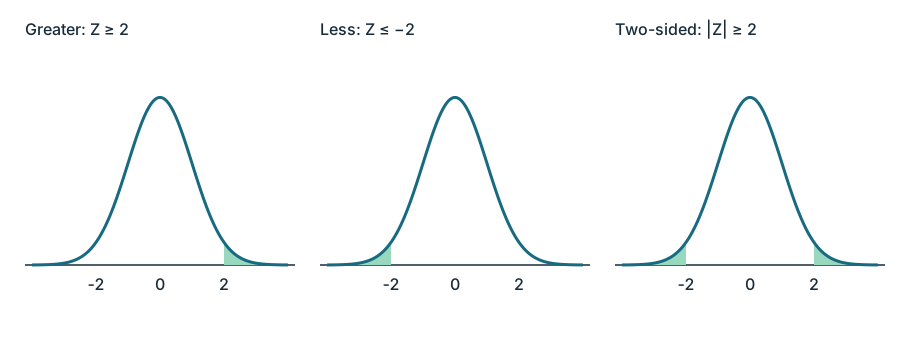
Simulation gives the same idea in counts. Generate many same-size samples under the null parameter, calculate the statistic for each, and count the proportion at least as extreme. The null-generated samples are a probability model, not additional observations from the real population. If 1,000 simulated standardized statistics include 24 at or below −2 and 31 at or above 2, an observed +2 has greater-tail p≈0.031. An observed −2 with a less alternative has p≈0.024. A two-sided ±2 result uses (24+31)/1,000=0.055, including equality in both tails. Do not automatically double one simulated tail: a finite run may not be exactly symmetric. A theoretical normal curve gives 0.02275 in either single tail and 0.04550 in both. Simulation estimates fluctuate from run to run; more repetitions improve Monte Carlo precision.
Interpret the city worked example as: if the population bottle-carrying proportion really were 0.40, about 2.64% of SRSs of 160 would have a sample proportion at least 0.475. A small p-value makes the result unusual under the null and supplies evidence for the alternative; smaller values supply stronger statistical evidence. A large p-value supplies neither convincing alternative evidence nor evidence proving the null. No p-value here is the probability H₀ is true.
Make a decision, then answer the question
The significance level α is the predetermined probability of rejecting H₀ when it is true. It can be supplied or chosen by the investigator before examining results. At a prespecified α=0.05, the worked example’s p≈0.0264≤0.05 gives reject H₀. There is convincing statistical evidence that more than 40% of city residents carry a bottle. This conclusion names the population parameter, follows the alternative and uses evidence language rather than “proves.”
If the same valid study had p=0.18, p>α would give fail to reject H₀: not enough convincing evidence of a proportion above 0.40. A test can reject or fail to reject; it cannot establish that H₀ is true. Lack of evidence for a claim is different from evidence that the claim is false. A study with low power can miss a real difference. The result is statistical reasoning that answers the original investigative question; it does not report an unexplained calculator decision or assert every resident behaves the same way.
Keep the p-value and decision distinct. A p-value of 0.032 fails to reject at α=0.01 but rejects at α=0.05. The data and conditional probability have not changed. Choosing the threshold after seeing which answer is favorable no longer follows the prespecified error-rate procedure.
Independent Application
Work through each investigation before opening the separate solutions. State parameters, show calculations and connect your reasoning to the actual study.
Original generated practice for the Fall 2026 course.
Glossary and deeper reading · 17 refreshers
These editorial refreshers supplement the reading. Definitions and examples are added guidance; original source wording and recorded answers remain in their original context.
-
Sample
A sample is the subset of a population actually studied. How it is selected matters for the conclusions that can be drawn about the population. For example, 60 selected students may be a sample from a school’s full enrollment.
-
Population proportion
A population proportion is the fraction of the entire population with a specified characteristic. It is a parameter, commonly written p, that a sample proportion can estimate. For example, the fraction of all enrolled students who walk to school is the population proportion of walkers.
Read more: Population proportion in the captured Statistics reading →
-
Mean
The mean is a measure of center often called an average. For a finite data set, the arithmetic mean is the sum of the values divided by their number; for a random variable, the mean is its probability-weighted expected value when that value exists. Means can be pulled toward extreme values and are not generally resistant. For example, the arithmetic mean of 2, 4, and 9 is 5.
-
Population
A population is the full set of individuals or measurements a study aims to describe. It must be defined clearly before deciding whether a sample supports generalization. For example, all students enrolled in a particular school this year form a population.
-
One-sided test
A one-sided test seeks evidence for a specified direction of departure from the null claim. Its relevant extreme outcomes lie in one direction of the test statistic’s distribution. For example, a greater-than alternative asks whether a population mean exceeds a stated value.
Read more: One-sided test in the captured Statistics reading →
-
Observation
An observation is a recorded value or set of values for an individual or occasion. The individual may be a person, object, or event rather than a human subject. For example, one plant’s measured height is an observation in a plant-growth study.
-
Random sampling
Random sampling uses a specified chance process to select individuals from a population. It supports population inference when the sampling frame and data collection are appropriate, but does not guarantee perfect balance or eliminate every source of bias. For example, a random-number generator can select student identifiers from an enrollment list.
Read more: Random sampling in the captured Statistics reading →
-
Simple random sample
A simple random sample of a fixed size gives every possible subset of that size the same chance of selection. Giving individuals equal selection chances alone does not establish that the design is an SRS. For example, randomly choosing three identifiers without replacement from ten gives an SRS when every three-identifier set is equally likely.
Read more: Simple random sample in the captured Statistics reading →
-
Point estimate
A point estimate is the specific numerical value obtained from an estimator for the observed sample. It gives one estimate without expressing uncertainty by itself. For example, a sample mean of 14 minutes is a point estimate of the population’s mean travel time.
Read more: Point estimate in the captured Statistics reading →
-
Test statistic
A test statistic summarizes how the sample departs from the null model. Its reference distribution under the null supplies the probabilities used in testing. For example, a z-statistic expresses a sample proportion’s difference from a hypothesized proportion in null-model standard-error units.
Read more: Test statistic in the captured Statistics reading →
-
P-value
A p-value is the probability, under the null model and its assumptions, of results at least as extreme as those observed in the direction or directions specified by the test. It does not give the probability that the null hypothesis is true or measure the practical size of an effect. For example, a p-value of 0.03 describes a 3% tail probability under the null model, rather than a 3% probability that the null is correct.
-
Probability
Probability quantifies how likely an event is under a specified chance model. It lies between 0 and 1, with larger values representing greater likelihood. For example, drawing a red card from a well-shuffled standard deck has probability one half.
-
Simulation
A simulation imitates a chance process using a specified model. Repeated simulated outcomes can approximate probabilities when the model faithfully represents the situation. For example, random digits can model repeated draws from a bag with known color proportions.
-
Population parameter
A population parameter is a numerical feature of the population or probability model being studied. It is fixed for that defined population, although its value may be unknown. For example, the true proportion of all enrolled students who walk to school is a parameter.
Read more: Population parameter in the captured Statistics reading →
-
Sample proportion
A sample proportion is the number of sampled individuals with a specified characteristic divided by the sample size. It is commonly written p-hat and estimates the corresponding population proportion. For example, 18 walkers among 60 sampled students give a sample proportion of 0.30.
Read more: Sample proportion in the captured Statistics reading →
-
Significance level
A significance level is a threshold selected before testing to limit Type I errors under the null model. A p-value at or below that threshold leads to rejection under the stated rule, while a larger p-value leads to failure to reject. For example, an alpha level of 0.01 demands stronger incompatibility with the null model than a level of 0.05.
Read more: Significance level in the captured Statistics reading →
-
Conditional probability
Conditional probability measures the likelihood of one event when another event is known to have occurred. It restricts attention to the conditioning event, which must have positive probability. For example, knowing a drawn card is a face card changes the denominator when finding the probability it is a queen.
Read more: Conditional probability in the captured Statistics reading →