Two-Way Tables: Homogeneity and Independence
These lessons and problems are newly written for the revised course. Worked examples show complete reasoning; the application questions ask you to make and defend your own choices.
Let the sampling design name the test
A two-way table is a display, not a complete study design. If independent samples come from two or more populations and one categorical response is compared, a chi-square homogeneity test asks whether their response distributions are the same. Three independently sampled towns and one commute category fit this design. Identify the response variable and every target population when stating the question.
If one random sample from a single population records two categorical variables on each individual, a chi-square independence test asks whether those variables are associated in that population. One sample of city residents, each classified by dwelling and park-visit frequency, fits this design. State both variables and the population. Row labels alone do not tell us that two independent samples were selected. Quantitative averages, paired numerical changes and categorical counts call for different methods.
For homogeneity, H₀ says the categorical response distributions are the same across populations or randomized treatments; Hₐ says a difference exists. The alternative need not mean every pair differs. For independence, H₀ says no association, equivalently the variables are independent in the population. Hₐ says association, equivalently not independent. These claims concern distributions and variables, not whether every displayed count is equal.
Calculate what the null would expect
Under a shared distribution or independence, the expected count in a cell is its row total times column total divided by the whole-table total. Expected counts need not be integers. They are the null model’s predicted counts, not new observed people.
In a new worked example, independent SRSs of 60 people from each of three large towns give commute counts (walk,bus,drive): A=(30,20,10), B=(20,20,20), C=(10,20,30). Each row total is 60; each column total is 60; total 180. Thus every expected cell is 60(60)/180=20.
The randomization condition for independence is one random sample; for homogeneity it is independent random samples or a randomized experiment. For sampling without replacement, check n≤10%N in the relevant sampled population(s). The sampling condition is unnecessary when the data arise from randomized treatment assignment rather than population sampling. Random assignment and random selection support different scopes of conclusion. Finally, every expected count must be greater than 5. The required comparison is strict: an expected count exactly 5 does not meet it. Use expected rather than observed counts. In the worked town example, suppose each town has at least 3,000 people: 60≤300 and all expected counts 20>5, so all three conditions have concrete support.
Add discrepancies across the entire table
The chi-square statistic measures observed-versus-expected distance relative to expected counts. Squaring makes a deficit and an excess both contribute positively; division by E scales the contribution. Sum over all cells, including zero-contribution cells, rather than selecting the most dramatic row.
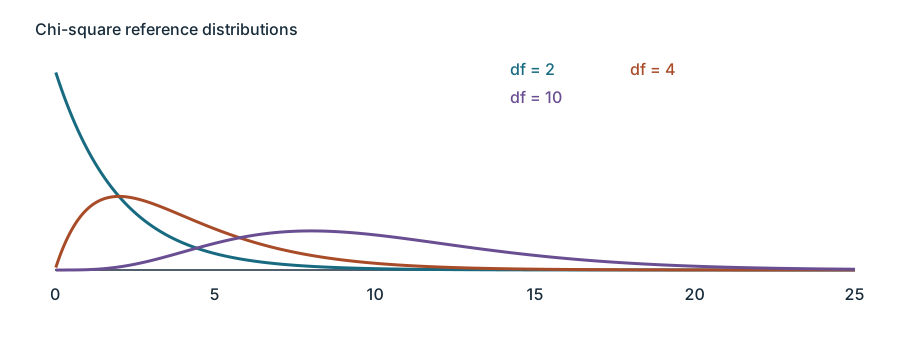
The worked table has four cells 10 away from their expected 20, each contributing 100/20=5, and five cells at their expected count, each contributing 0. Therefore χ²=20 and df=(3−1)(3−1)=4. Under H₀, the approximate reference distribution is chi-square with df=4; a table or distribution technology gives upper-tail p≈0.0004994.
Chi-square distributions have positive support and right skew; the statistic itself can be zero when every observed count equals its expectation. Increasing df makes the right skew less pronounced. Larger statistics mean more discrepancy, so p-values use the upper tail, regardless of whether particular cells have positive or negative O−E. Do not double this tail merely because some cells are above and others below expectation.
Answer the distribution or association question
The worked p-value means: assuming the three town commute distributions are the same, the probability of a table yielding a chi-square discrepancy at least 20 in these samples is about 0.0004994. It does not mean there is a 0.04994% chance the towns are the same. At α=0.05, p≤α gives reject H₀. There is convincing evidence that commute-choice distributions are not all the same across these town populations. The test is an omnibus comparison; it does not identify every differing category or establish that town residence caused the pattern.
For independence, interpret the probability assuming the two variables are independent in the sampled population. A small p supports an association; a larger p>α gives fail to reject and a statement that evidence of association is insufficient. It does not prove independence. State conclusions in context, consistently with the alternative and with non-definitive evidence language. The investigation concerns one sampled population for independence or several sampled populations for homogeneity; preserve that distinction when answering the original question.
Independent Application
Work through each investigation before opening the separate solutions. State parameters, show calculations and connect your reasoning to the actual study.
Original generated practice for the Fall 2026 course.
Glossary and deeper reading · 13 refreshers
These editorial refreshers supplement the reading. Definitions and examples are added guidance; original source wording and recorded answers remain in their original context.
-
Two-way table
A two-way table organizes counts for combinations of two categorical variables. The cells show combinations, while row and column totals summarize each variable separately. For example, a table can classify students by grade level and whether they walk to school.
Read more: Two-way table in the captured Statistics reading →
-
Sample
A sample is the subset of a population actually studied. How it is selected matters for the conclusions that can be drawn about the population. For example, 60 selected students may be a sample from a school’s full enrollment.
-
Random sampling
Random sampling uses a specified chance process to select individuals from a population. It supports population inference when the sampling frame and data collection are appropriate, but does not guarantee perfect balance or eliminate every source of bias. For example, a random-number generator can select student identifiers from an enrollment list.
Read more: Random sampling in the captured Statistics reading →
-
Population
A population is the full set of individuals or measurements a study aims to describe. It must be defined clearly before deciding whether a sample supports generalization. For example, all students enrolled in a particular school this year form a population.
-
Treatment
A treatment is a specific condition imposed on an experimental unit. In a multifactor experiment, a treatment is a combination of factor levels. For example, low fertilizer with eight hours of light is one treatment combination.
-
Mean
The mean is a measure of center often called an average. For a finite data set, the arithmetic mean is the sum of the values divided by their number; for a random variable, the mean is its probability-weighted expected value when that value exists. Means can be pulled toward extreme values and are not generally resistant. For example, the arithmetic mean of 2, 4, and 9 is 5.
-
Statistical independence
Statistical independence means that learning one outcome does not change the probability distribution of another. For two events, it implies that the probability of both occurring equals the product of their probabilities. For example, independent draws with replacement keep the second draw’s color probabilities unchanged by the first.
Read more: Statistical independence in the captured Statistics reading →
-
Expected count
An expected count is the count predicted for a category or cell under the null model. Goodness-of-fit expectations use the total count times the null proportion, while independence-table expectations use row total times column total divided by the grand total. For example, a null proportion of 0.2 in 50 trials gives an expected count of 10.
-
Experiment
An experiment deliberately imposes treatments and measures responses. Random assignment, comparison, and replication help distinguish treatment effects from other variation. For example, assigning plants to fertilizer treatments is an experiment.
-
Sampling without replacement
Sampling without replacement does not return selected items before later selections. Selections from a finite population are dependent, although treating them as approximately independent can be reasonable when the sample is a small fraction of the population. For example, selecting students without replacement ensures that no student is chosen twice.
Read more: Sampling without replacement in the captured Statistics reading →
-
Chi-square statistic
For categorical-count tests, the chi-square statistic adds each cell’s squared observed-minus-expected difference divided by its expected count. Large contributions identify cells with substantial discrepancies relative to their expected counts. For example, a cell observed 15 times when 10 are expected contributes 2.5 to the statistic.
-
Chi-square distribution
A chi-square distribution is a nonnegative reference distribution whose shape depends on degrees of freedom. It is the distribution of a sum of squared independent standard Normal variables. For example, categorical-count tests compare a suitably constructed chi-square statistic with this reference distribution.
-
Sample statistic
A statistic is a numerical summary calculated from sample data. Its value can change when a different sample is selected from the same population. For example, the proportion of walkers among 60 sampled students is a statistic.
Read more: Sample statistic in the captured Statistics reading →