3.4 Normal Distributions
Section Overview
- Interactive 3.4.1 - Area w/ Dens. Curves
- Gallery 3.4.1 - Distribution Symmetry
- Interactive 3.4.2 - 67-95-99.7 Rule
- Gallery 3.4.2 - z-table
- Example 3.4.1
- Pop Quiz 3.4.1
Density Curves
From all of the plotting methods that we’ve learned so far, the histogram comes close to resembling a density curve, which we can use to approximate the total area of the histogram bars. It is defined as a curve that:
- Is always on or above the horizontal axis
- Has area of exactly 1 underneath it
- Represents an idealized pattern. A symmetric density curve is exactly symmetric, so the mean and median are both located dead-center. These symmetric density curves are a special class of curves, where the distribution they describe are called Normal distributions. For right-skewed density curves, the mean is greater than the median. This is because there is a greater proportion of larger values that pulls the mean away from the median. This applies in exactly the opposite way for left-skewed density curves. See Gallery 3.4.1 for a better idea.
- Has mean (pronounced “mu”) distinguinguished from , standard deviation , and variance (pronounced “sigma”) distinguished from .
Features of Normal Distributions
One feature that all Normal distributions with mean and standard deviation share in common is the 68-95-99.7 Rule. It states that:
- Approximately 68% of the observations fall within of the mean .
- Approximately 95% of the observations fall within of the mean .
- Approximately 99.7% of the observations fall within of the mean .
This rule can be illustrated in Interactive 3.4.2
Interactive 3.4.1 Approximating Area with Density Curves
Gallery 3.4.1 Distribution Symmetry
Frame 1 of 3
This is a symmetric distribution. The mean and the median share the same value. Open full-size image S0259Frame 2 of 3
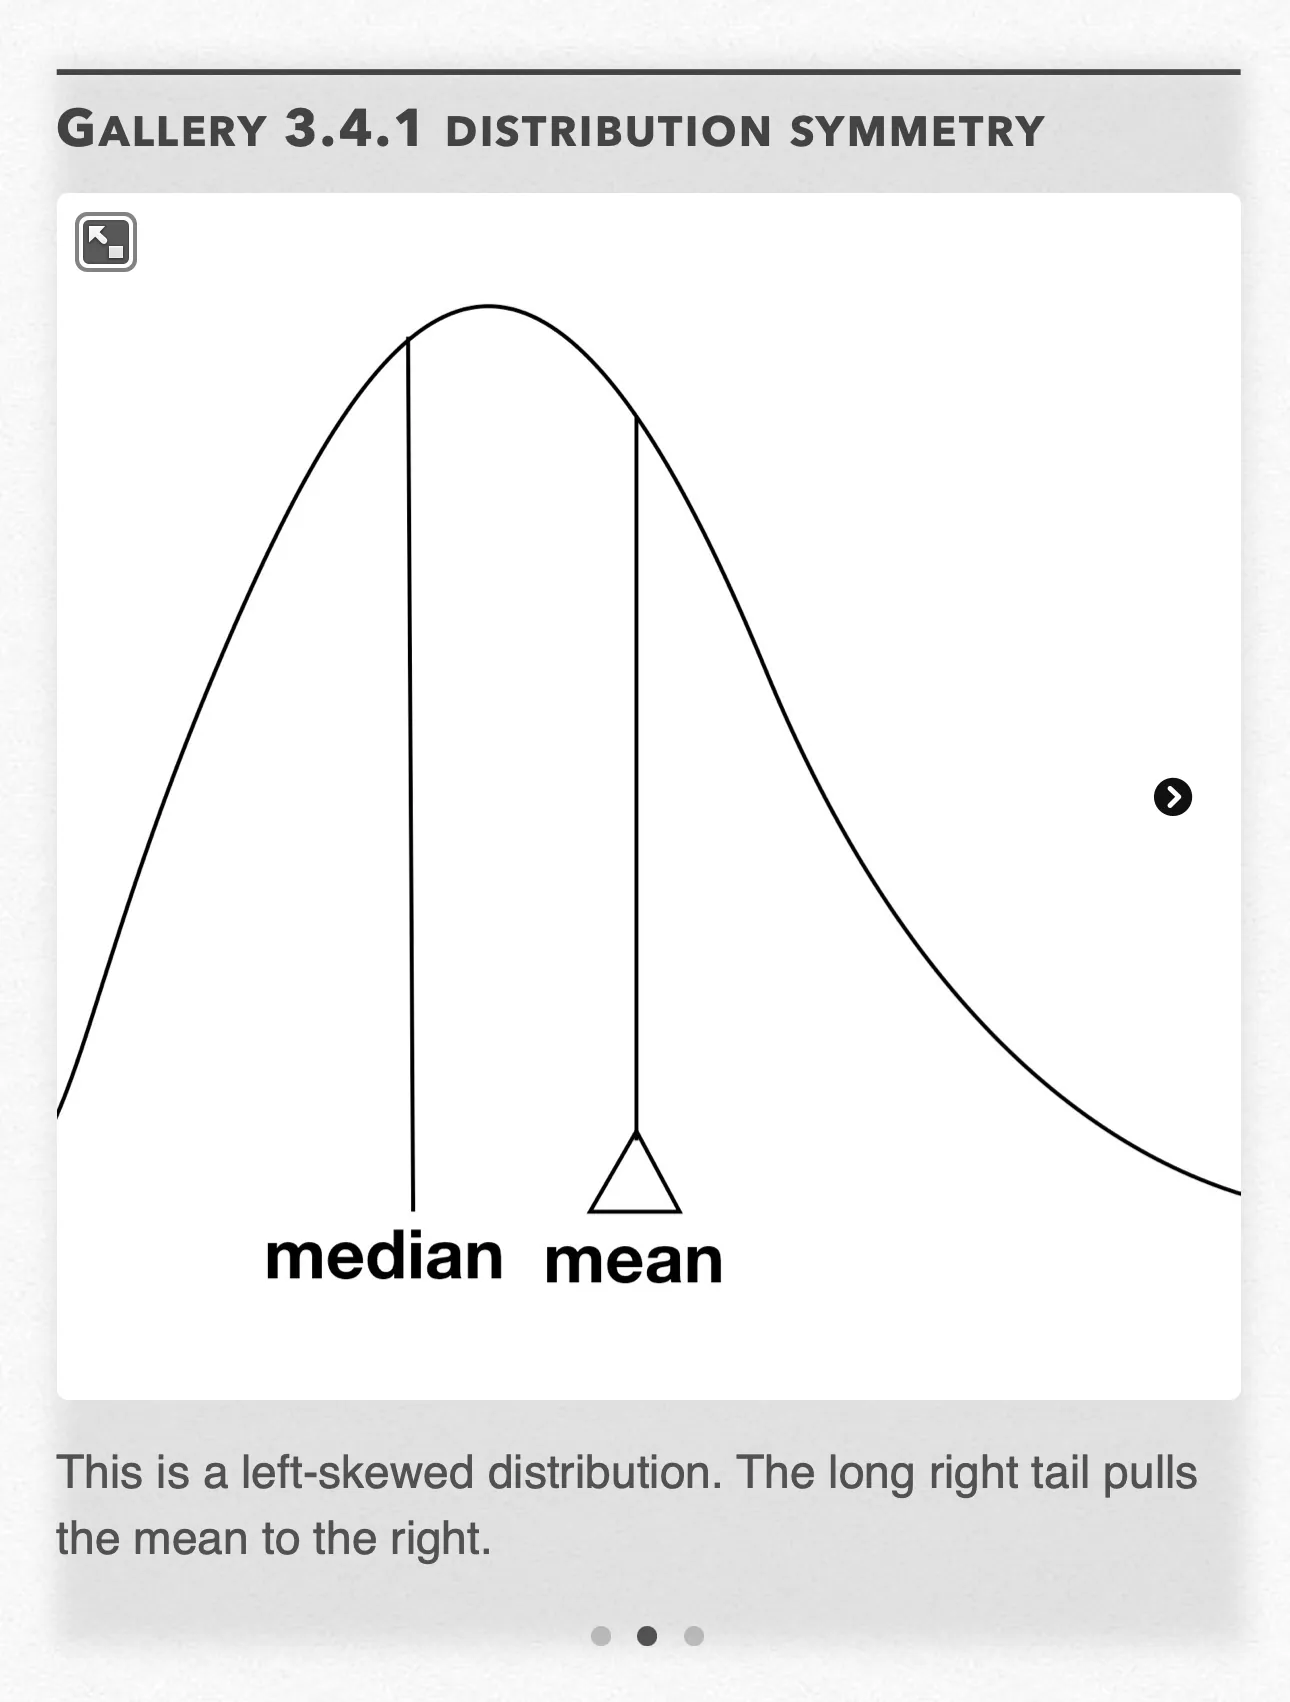
This is a left-skewed distribution. The long right tail pulls the mean to the right. Open full-size image S0260Frame 3 of 3
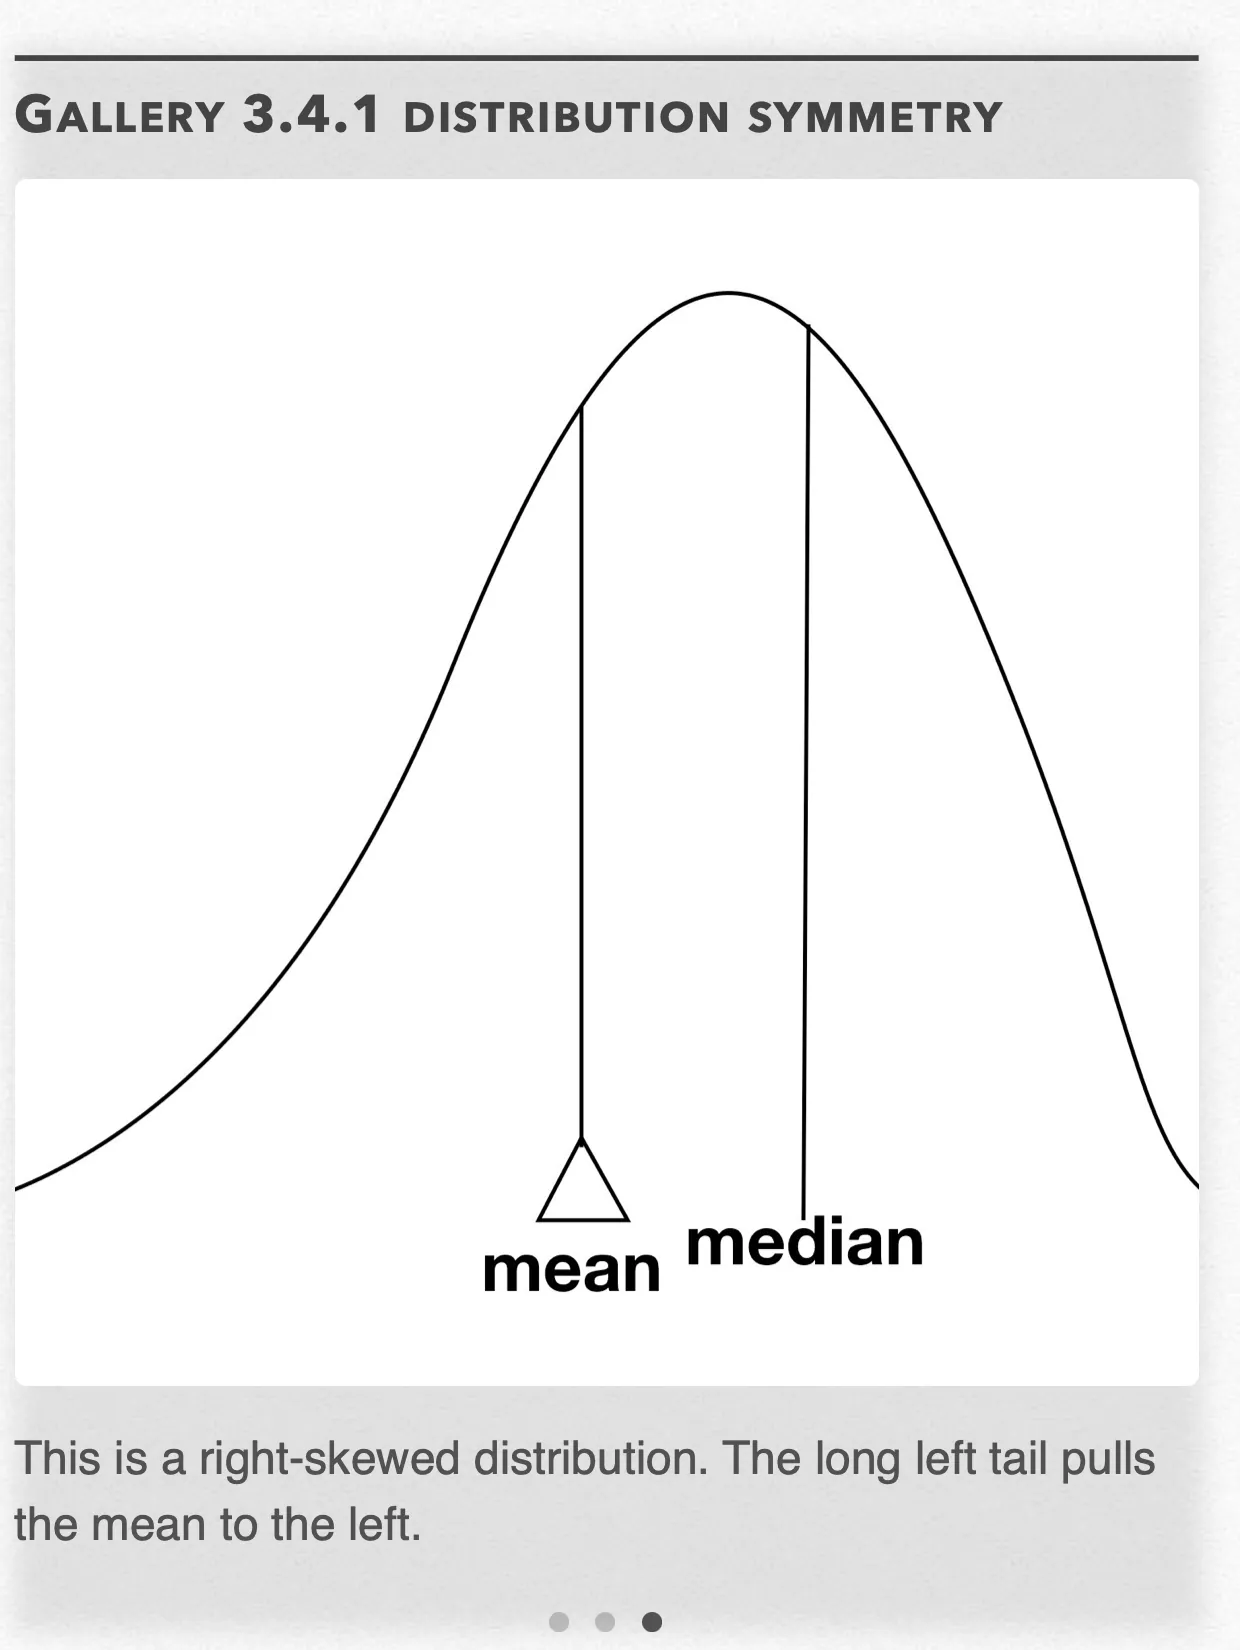
This is a right-skewed distribution. The long left tail pulls the mean to the left. Open full-size image S0262
Capture provenance
Filename capture times, with no recorded timezone. Frames above follow the original gallery positions.
- · S0259 · displayed frame 1
Screenshot 2026-10-05 at 3.54.12 PM.png - · S0260 · displayed frame 2
Screenshot 2026-10-05 at 3.54.16 PM.png - · S0262 · displayed frame 3
Screenshot 2026-10-05 at 3.54.27 PM.png
Normal distributions can be standardized to what are called standard Normal distributions using the z-score formula and our “new” mean and standard deviation to find the z-score:
This z-score or z-value is a value that falls on the standard Normal distribution, where it has and . All of these z-values fall under a table called the z-table, where each z-value corresponds to a shaded “cumulative” probability up to that z-value. See Gallery 3.4.2 for a complete z-table.
Interactive 3.4.2 67-95-99.7 Rule
67% — recorded annotation
67% covers data that is between 1 standard deviation less than the mean and 1 standard deviation greater than the mean and is represented by the yellow region.
95% — recorded annotation
95% of the data is between 2 standard deviations less than the mean and 2 standard deviations greater than the mean and is represented by the yellow and orange regions.
99.7% — recorded annotation
99.7% of the data is between 3 standard deviations less than the mean and 3 standard deviation greater than the mean and is represented by the yellow, orange, and red regions.
Gallery 3.4.2 z-table
Frame 1 of 4
This part of the z table gives the corresponding probabilities from z=−3.49 to z=−1.75 Open full-size image S0263Frame 2 of 4
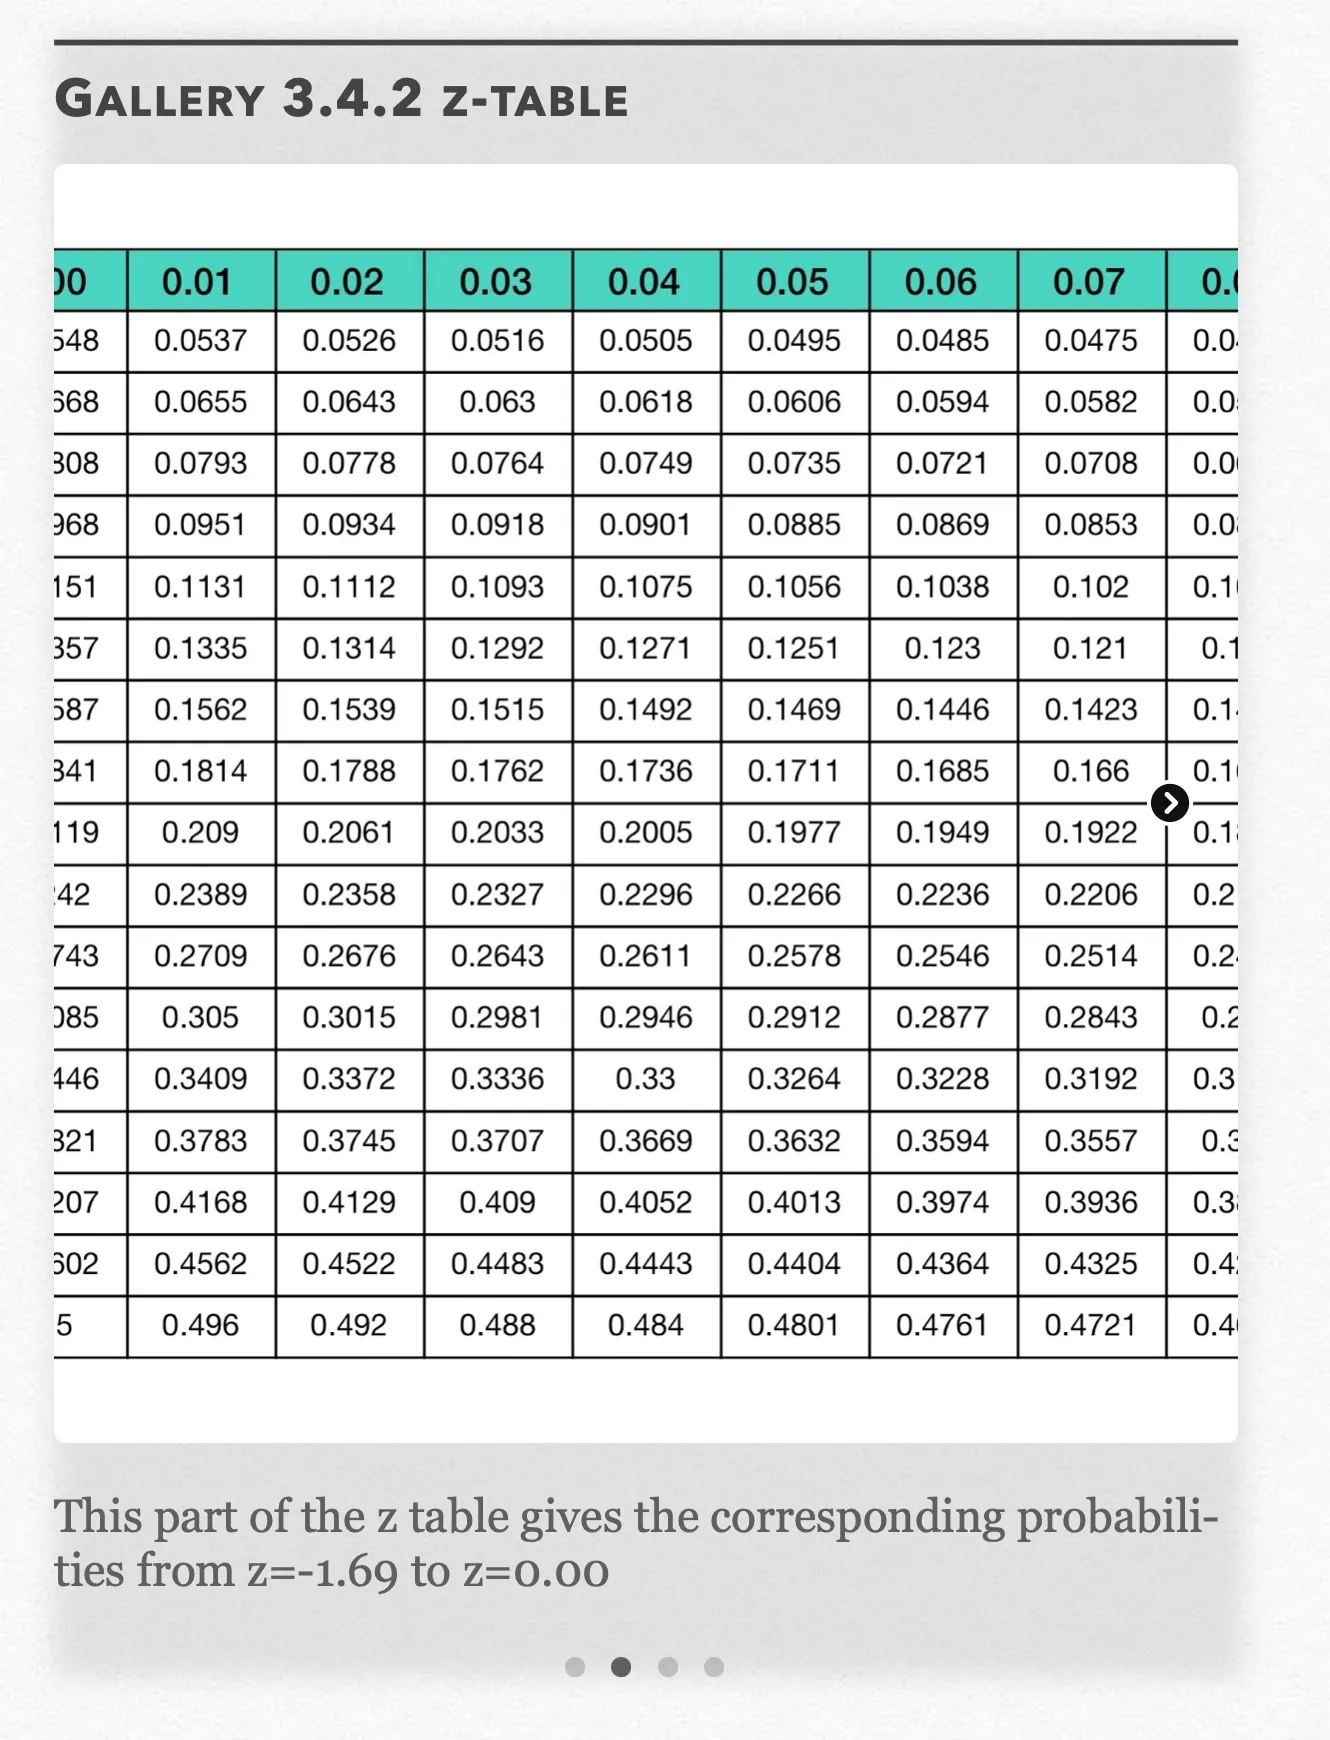
This part of the z table gives the corresponding probabilities from z=−1.69 to z=0.00 Open full-size image S0267Frame 3 of 4
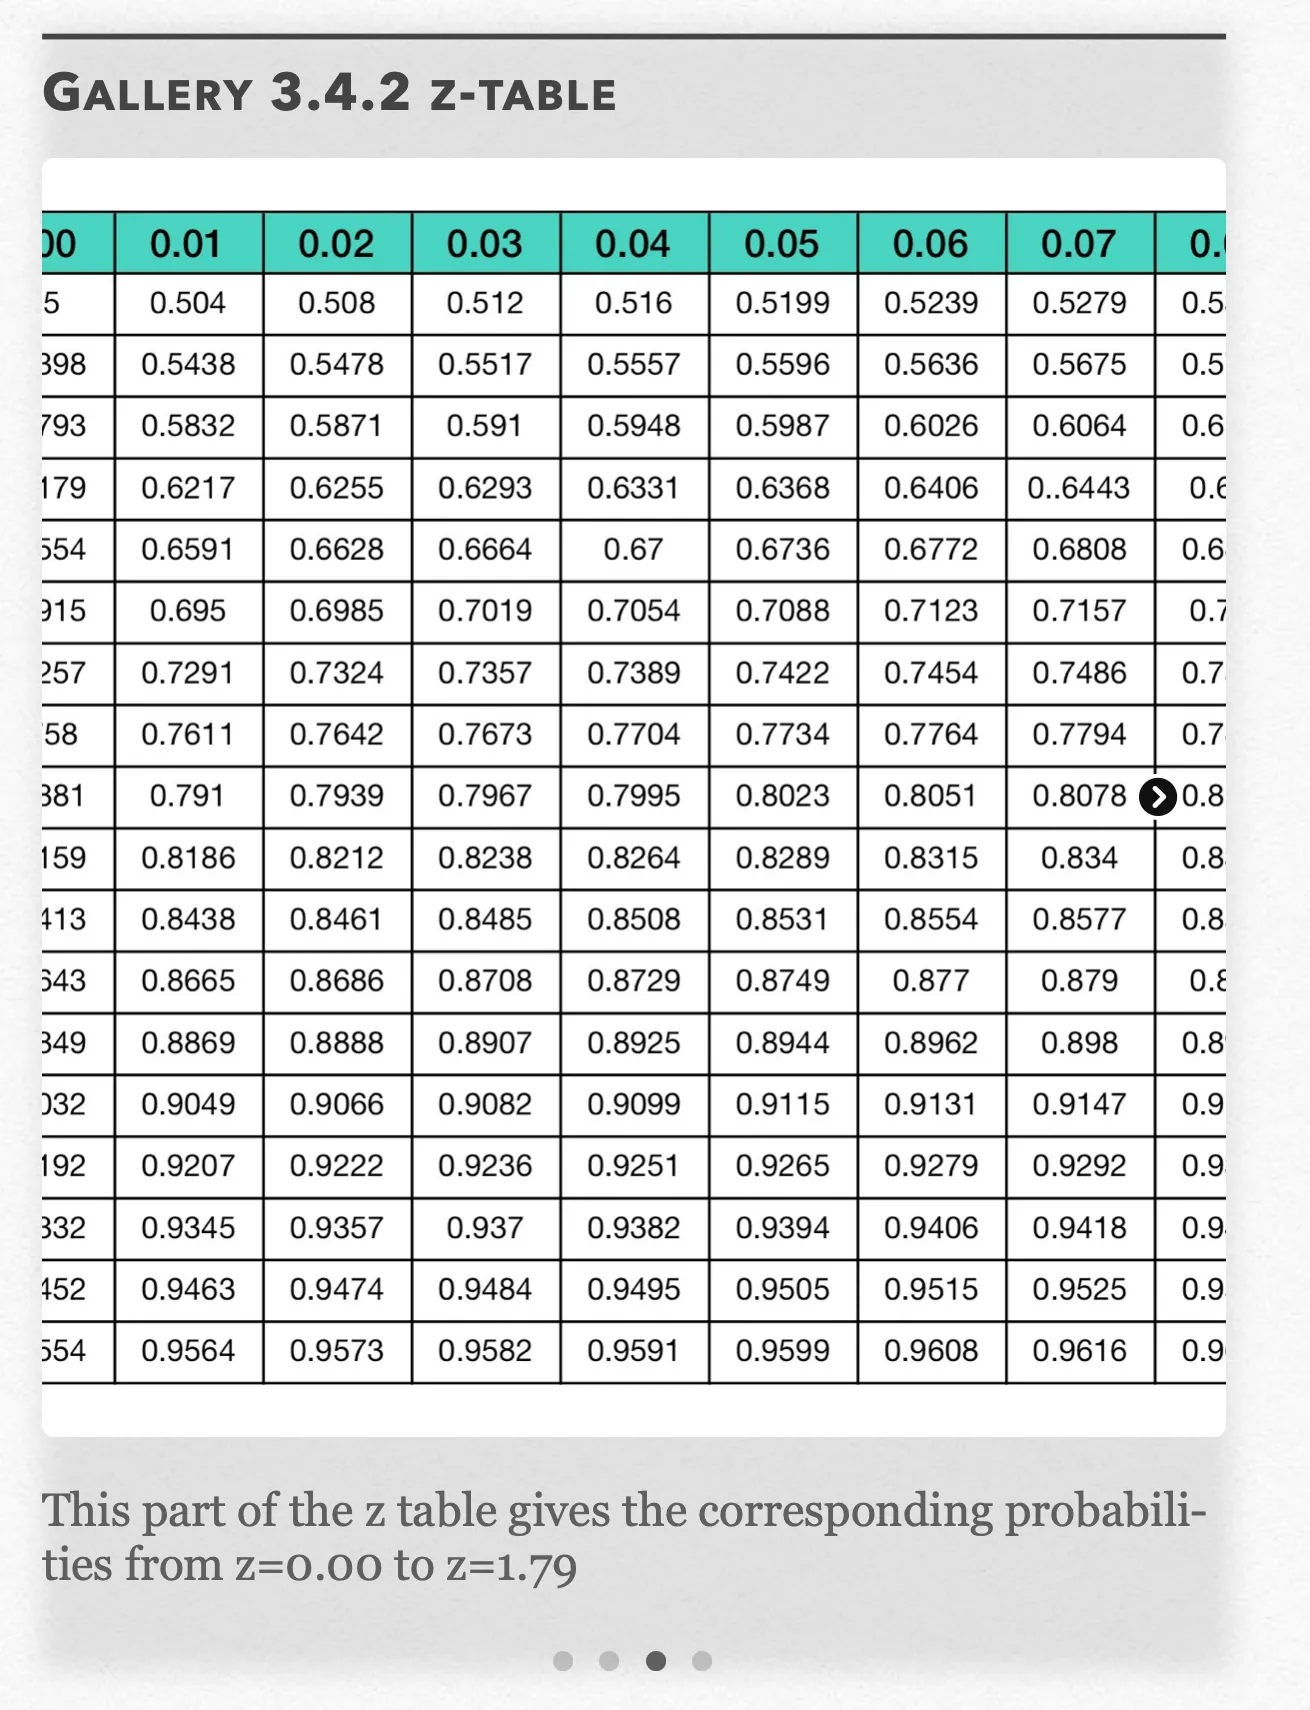
This part of the z table gives the corresponding probabilities from z=0.00 to z=1.79 Open full-size image S0268Frame 4 of 4
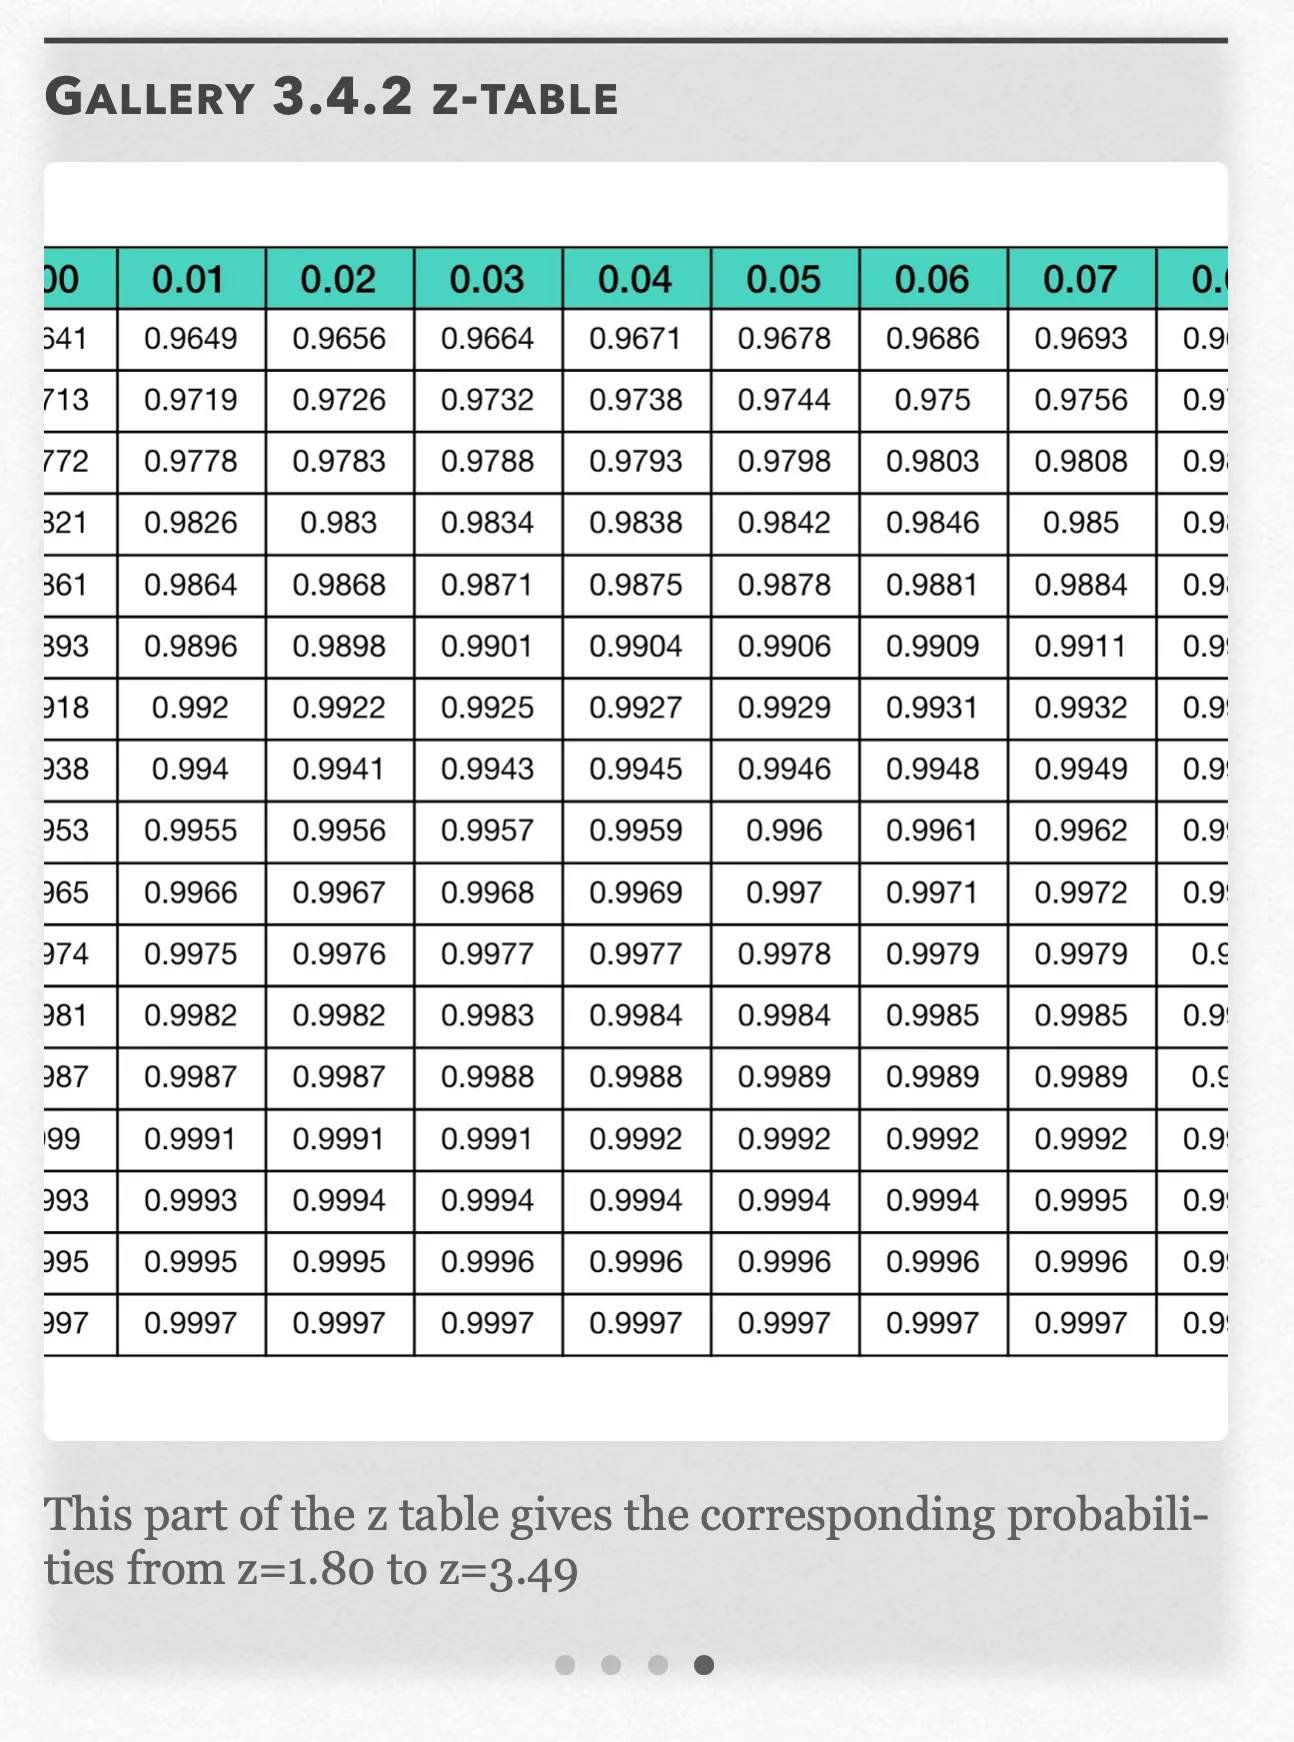
This part of the z table gives the corresponding probabilities from z=1.80 to z=3.49 Open full-size image S0269
Capture provenance
Filename capture times, with no recorded timezone. Frames above follow the original gallery positions.
- · S0263 · displayed frame 1
Screenshot 2026-10-05 at 3.54.31 PM.png - · S0267 · displayed frame 2
Screenshot 2026-10-05 at 3.55.04 PM.png - · S0268 · displayed frame 3
Screenshot 2026-10-05 at 3.55.09 PM.png - · S0269 · displayed frame 4
Screenshot 2026-10-05 at 3.55.13 PM.png
Gallery 3.4.2 — frame 1 visible cells
| Visible row | 0.01 | 0.02 | 0.03 | 0.04 | 0.05 | 0.06 | 0.07 |
|---|---|---|---|---|---|---|---|
| 1 | 0.0003 | 0.0003 | 0.0003 | 0.0003 | 0.0003 | 0.0003 | 0.0003 |
| 2 | 0.0005 | 0.0005 | 0.0004 | 0.0004 | 0.0004 | 0.0004 | 0.0004 |
| 3 | 0.0007 | 0.0006 | 0.0006 | 0.0006 | 0.0006 | 0.0006 | 0.0005 |
| 4 | 0.0009 | 0.0009 | 0.0009 | 0.0008 | 0.0008 | 0.0008 | 0.0008 |
| 5 | 0.0013 | 0.0013 | 0.0012 | 0.0012 | 0.0011 | 0.0011 | 0.0011 |
| 6 | 0.0018 | 0.0018 | 0.0017 | 0.0016 | 0.0016 | 0.0015 | 0.0015 |
| 7 | 0.0025 | 0.0024 | 0.0023 | 0.0023 | 0.0022 | 0.0021 | 0.0021 |
| 8 | 0.0034 | 0.0033 | 0.0032 | 0.0031 | 0.003 | 0.0029 | 0.0028 |
| 9 | 0.0045 | 0.0044 | 0.0043 | 0.0041 | 0.004 | 0.0039 | 0.0038 |
| 10 | 0.006 | 0.0059 | 0.0057 | 0.0055 | 0.0054 | 0.0052 | 0.0051 |
| 11 | 0.008 | 0.0078 | 0.0075 | 0.0073 | 0.0071 | 0.0069 | 0.0068 |
| 12 | 0.0104 | 0.0102 | 0.0099 | 0.0096 | 0.0094 | 0.0091 | 0.0089 |
| 13 | 0.0136 | 0.0132 | 0.0129 | 0.0125 | 0.0122 | 0.0119 | 0.0116 |
| 14 | 0.0174 | 0.017 | 0.0166 | 0.0162 | 0.0158 | 0.0154 | 0.015 |
| 15 | 0.0222 | 0.0217 | 0.0212 | 0.0207 | 0.0202 | 0.0197 | 0.0192 |
| 16 | 0.0281 | 0.0274 | 0.0268 | 0.0262 | 0.0256 | 0.025 | 0.0244 |
| 17 | 0.0351 | 0.0344 | 0.0336 | 0.0329 | 0.0322 | 0.0314 | 0.0307 |
| 18 | 0.0436 | 0.0427 | 0.0418 | 0.0409 | 0.0401 | 0.0392 | 0.0384 |
Gallery 3.4.2 — frame 2 visible cells
| Visible row | 0.01 | 0.02 | 0.03 | 0.04 | 0.05 | 0.06 | 0.07 |
|---|---|---|---|---|---|---|---|
| 1 | 0.0537 | 0.0526 | 0.0516 | 0.0505 | 0.0495 | 0.0485 | 0.0475 |
| 2 | 0.0655 | 0.0643 | 0.063 | 0.0618 | 0.0606 | 0.0594 | 0.0582 |
| 3 | 0.0793 | 0.0778 | 0.0764 | 0.0749 | 0.0735 | 0.0721 | 0.0708 |
| 4 | 0.0951 | 0.0934 | 0.0918 | 0.0901 | 0.0885 | 0.0869 | 0.0853 |
| 5 | 0.1131 | 0.1112 | 0.1093 | 0.1075 | 0.1056 | 0.1038 | 0.102 |
| 6 | 0.1335 | 0.1314 | 0.1292 | 0.1271 | 0.1251 | 0.123 | 0.121 |
| 7 | 0.1562 | 0.1539 | 0.1515 | 0.1492 | 0.1469 | 0.1446 | 0.1423 |
| 8 | 0.1814 | 0.1788 | 0.1762 | 0.1736 | 0.1711 | 0.1685 | 0.166 |
| 9 | 0.209 | 0.2061 | 0.2033 | 0.2005 | 0.1977 | 0.1949 | 0.1922 |
| 10 | 0.2389 | 0.2358 | 0.2327 | 0.2296 | 0.2266 | 0.2236 | 0.2206 |
| 11 | 0.2709 | 0.2676 | 0.2643 | 0.2611 | 0.2578 | 0.2546 | 0.2514 |
| 12 | 0.305 | 0.3015 | 0.2981 | 0.2946 | 0.2912 | 0.2877 | 0.2843 |
| 13 | 0.3409 | 0.3372 | 0.3336 | 0.33 | 0.3264 | 0.3228 | 0.3192 |
| 14 | 0.3783 | 0.3745 | 0.3707 | 0.3669 | 0.3632 | 0.3594 | 0.3557 |
| 15 | 0.4168 | 0.4129 | 0.409 | 0.4052 | 0.4013 | 0.3974 | 0.3936 |
| 16 | 0.4562 | 0.4522 | 0.4483 | 0.4443 | 0.4404 | 0.4364 | 0.4325 |
| 17 | 0.496 | 0.492 | 0.488 | 0.484 | 0.4801 | 0.4761 | 0.4721 |
Gallery 3.4.2 — frame 3 visible cells
| Visible row | 0.01 | 0.02 | 0.03 | 0.04 | 0.05 | 0.06 | 0.07 |
|---|---|---|---|---|---|---|---|
| 1 | 0.504 | 0.508 | 0.512 | 0.516 | 0.5199 | 0.5239 | 0.5279 |
| 2 | 0.5438 | 0.5478 | 0.5517 | 0.5557 | 0.5596 | 0.5636 | 0.5675 |
| 3 | 0.5832 | 0.5871 | 0.591 | 0.5948 | 0.5987 | 0.6026 | 0.6064 |
| 4 | 0.6217 | 0.6255 | 0.6293 | 0.6331 | 0.6368 | 0.6406 | 0.6443 |
| 5 | 0.6591 | 0.6628 | 0.6664 | 0.67 | 0.6736 | 0.6772 | 0.6808 |
| 6 | 0.695 | 0.6985 | 0.7019 | 0.7054 | 0.7088 | 0.7123 | 0.7157 |
| 7 | 0.7291 | 0.7324 | 0.7357 | 0.7389 | 0.7422 | 0.7454 | 0.7486 |
| 8 | 0.7611 | 0.7642 | 0.7673 | 0.7704 | 0.7734 | 0.7764 | 0.7794 |
| 9 | 0.791 | 0.7939 | 0.7967 | 0.7995 | 0.8023 | 0.8051 | 0.8078 |
| 10 | 0.8186 | 0.8212 | 0.8238 | 0.8264 | 0.8289 | 0.8315 | 0.834 |
| 11 | 0.8438 | 0.8461 | 0.8485 | 0.8508 | 0.8531 | 0.8554 | 0.8577 |
| 12 | 0.8665 | 0.8686 | 0.8708 | 0.8729 | 0.8749 | 0.877 | 0.879 |
| 13 | 0.8869 | 0.8888 | 0.8907 | 0.8925 | 0.8944 | 0.8962 | 0.898 |
| 14 | 0.9049 | 0.9066 | 0.9082 | 0.9099 | 0.9115 | 0.9131 | 0.9147 |
| 15 | 0.9207 | 0.9222 | 0.9236 | 0.9251 | 0.9265 | 0.9279 | 0.9292 |
| 16 | 0.9345 | 0.9357 | 0.937 | 0.9382 | 0.9394 | 0.9406 | 0.9418 |
| 17 | 0.9463 | 0.9474 | 0.9484 | 0.9495 | 0.9505 | 0.9515 | 0.9525 |
| 18 | 0.9564 | 0.9573 | 0.9582 | 0.9591 | 0.9599 | 0.9608 | 0.9616 |
Gallery 3.4.2 — frame 4 visible cells
| Visible row | 0.01 | 0.02 | 0.03 | 0.04 | 0.05 | 0.06 | 0.07 |
|---|---|---|---|---|---|---|---|
| 1 | 0.9649 | 0.9656 | 0.9664 | 0.9671 | 0.9678 | 0.9686 | 0.9693 |
| 2 | 0.9719 | 0.9726 | 0.9732 | 0.9738 | 0.9744 | 0.975 | 0.9756 |
| 3 | 0.9778 | 0.9783 | 0.9788 | 0.9793 | 0.9798 | 0.9803 | 0.9808 |
| 4 | 0.9826 | 0.983 | 0.9834 | 0.9838 | 0.9842 | 0.9846 | 0.985 |
| 5 | 0.9864 | 0.9868 | 0.9871 | 0.9875 | 0.9878 | 0.9881 | 0.9884 |
| 6 | 0.9896 | 0.9898 | 0.9901 | 0.9904 | 0.9906 | 0.9909 | 0.9911 |
| 7 | 0.992 | 0.9922 | 0.9925 | 0.9927 | 0.9929 | 0.9931 | 0.9932 |
| 8 | 0.994 | 0.9941 | 0.9943 | 0.9945 | 0.9946 | 0.9948 | 0.9949 |
| 9 | 0.9955 | 0.9956 | 0.9957 | 0.9959 | 0.996 | 0.9961 | 0.9962 |
| 10 | 0.9966 | 0.9967 | 0.9968 | 0.9969 | 0.997 | 0.9971 | 0.9972 |
| 11 | 0.9975 | 0.9976 | 0.9977 | 0.9977 | 0.9978 | 0.9979 | 0.9979 |
| 12 | 0.9982 | 0.9982 | 0.9983 | 0.9984 | 0.9984 | 0.9985 | 0.9985 |
| 13 | 0.9987 | 0.9987 | 0.9988 | 0.9988 | 0.9989 | 0.9989 | 0.9989 |
| 14 | 0.9991 | 0.9991 | 0.9991 | 0.9992 | 0.9992 | 0.9992 | 0.9992 |
| 15 | 0.9993 | 0.9994 | 0.9994 | 0.9994 | 0.9994 | 0.9994 | 0.9995 |
| 16 | 0.9995 | 0.9995 | 0.9996 | 0.9996 | 0.9996 | 0.9996 | 0.9996 |
| 17 | 0.9997 | 0.9997 | 0.9997 | 0.9997 | 0.9997 | 0.9997 | 0.9997 |
Example 3.4.1 — recorded answer
a) To find the percent of Ulysses plushies that weigh less than 85 grams, we have to find the corresponding z-score. Plugging in our information into the z-score formula, we get:
Using the z-table, a z-value of −1.67 corresponds to a probability of 0.0475, which is the area to the left of on a standard normal distribution graph. This means that 4.75% of plushies weigh less than 85 grams.
b) To find the percent of Ulysses plushies that weigh between 85 and 92 grams, we have to find the corresponding z-score for both values. We already know the z-score for 85 grams is −1.67, so plugging in our information for the 92 gram value into the z-score formula, we get:
Again, we already know that a z-value of −1.67 corresponds to a probability of 0.0475. Using the z-table again for 0.67, we see it corresponds to a probability of 0.7486.
We are looking for the area between and on a standard Normal distribution graph, which we can find by calculating the difference between their corresponding probabilities:
This means that 75.11% of plushies weigh between 85 grams and 92 grams.
c) To find the percent of Ulysses plushies that weigh more than 93.4 grams, we have to find the corresponding z-score. Plugging in our information into the z-score formula, we get:
Using the z-table, a z-value of 1.13 corresponds to a probability of 0.8758, which is the area to the left of on a standard normal distribution graph. However, we want to know the percent of plushies that weigh more than 93.4 grams, which is the area to the right of . We can find this probability by subtracting 0.8758 from 1:
This means that 12.92% of plushies weigh more than 93.4 grams.
Gallery 3.4.3 Example 3.4.1
Frame 1 of 3
In part (a), a z-value of −1.67 means that 4.75% of plushies weigh less than 85 grams. Open full-size image S0272Frame 2 of 3
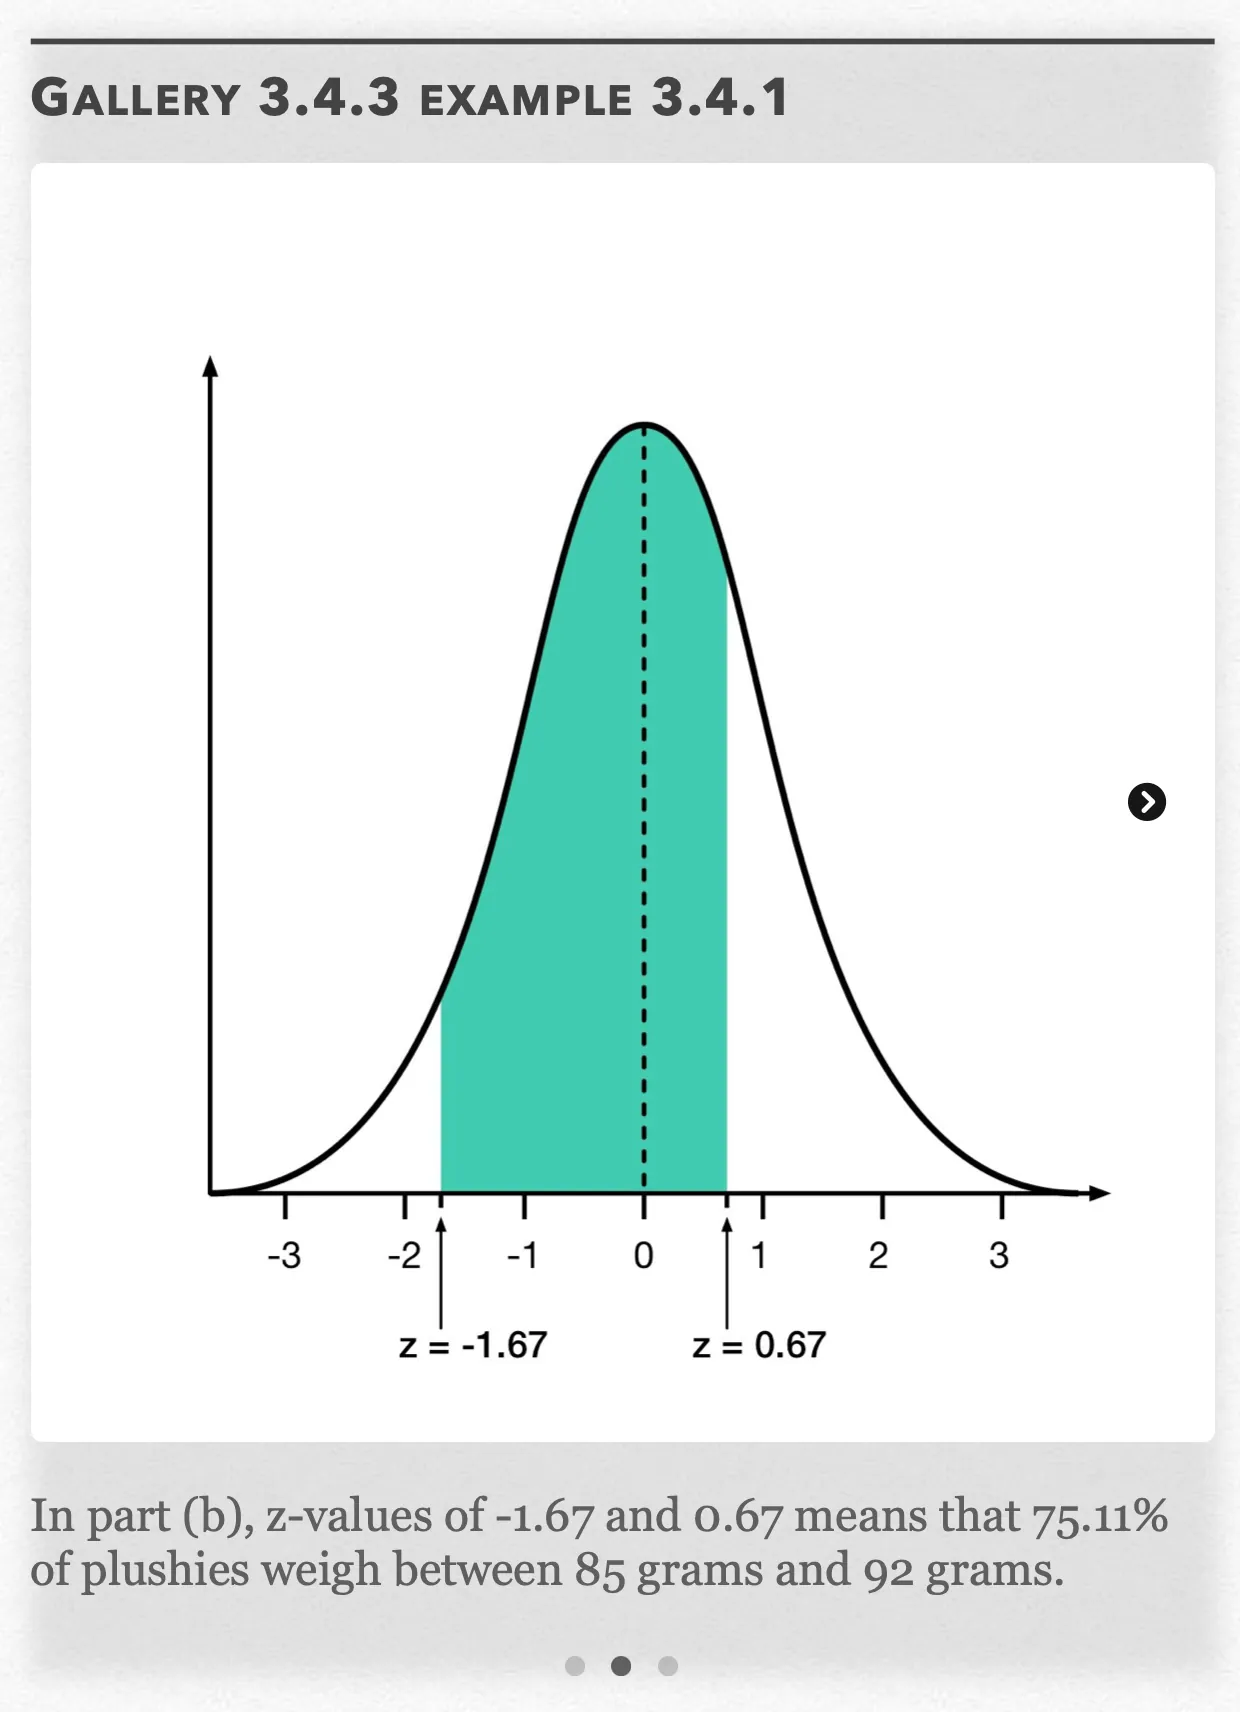
In part (b), z-values of −1.67 and 0.67 means that 75.11% of plushies weigh between 85 grams and 92 grams. Open full-size image S0273Frame 3 of 3
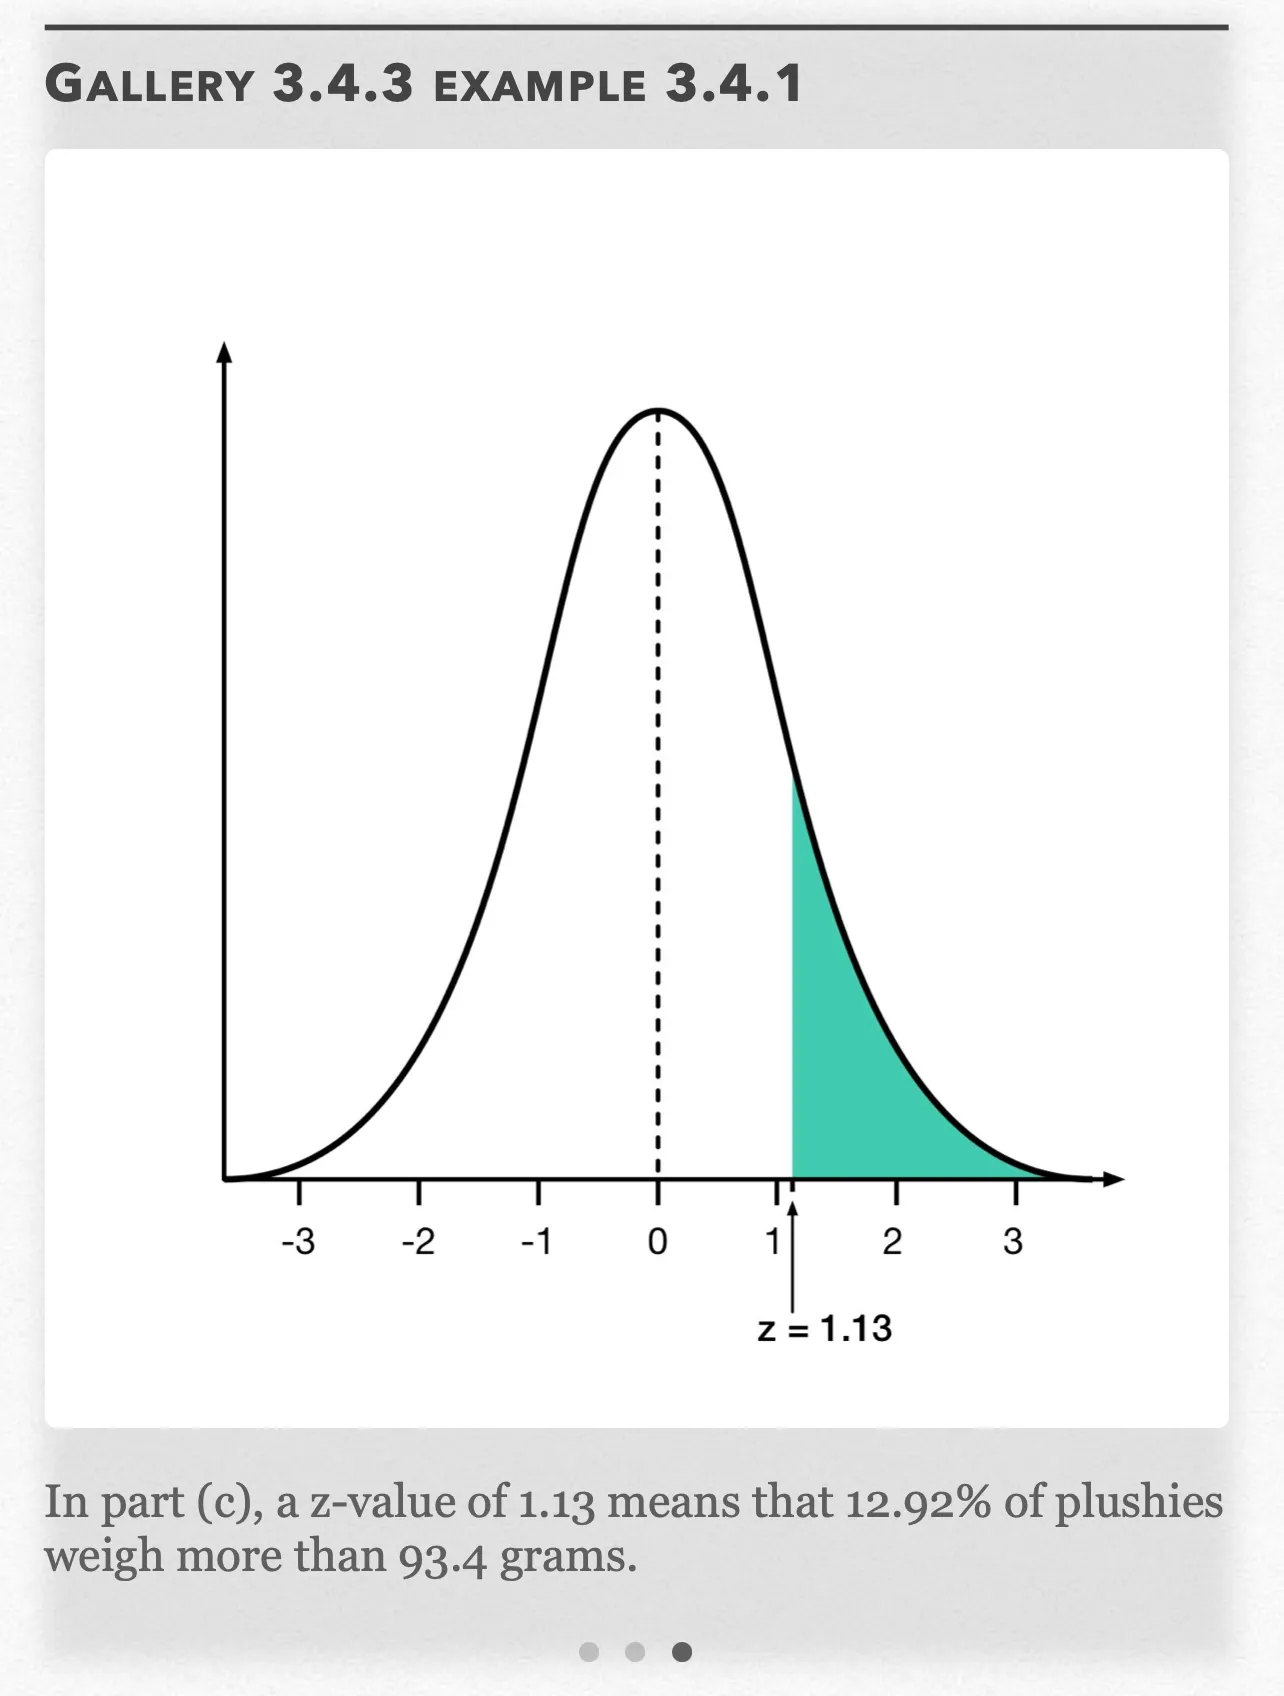
In part (c), a z-value of 1.13 means that 12.92% of plushies weigh more than 93.4 grams. Open full-size image S0274
Capture provenance
Filename capture times, with no recorded timezone. Frames above follow the original gallery positions.
- · S0272 · displayed frame 1
Screenshot 2026-10-05 at 3.55.22 PM.png - · S0273 · displayed frame 2
Screenshot 2026-10-05 at 3.55.27 PM.png - · S0274 · displayed frame 3
Screenshot 2026-10-05 at 3.55.31 PM.png
Pop Quiz 3.4.1
Glossary and deeper reading · 8 refreshers
These editorial refreshers supplement the reading. Definitions and examples are added guidance; original source wording and recorded answers remain in their original context.
-
Histogram
A histogram groups quantitative observations into numerical intervals and displays their frequencies or proportions. Neighboring bars represent adjacent intervals, so the graph preserves numerical order. For example, a histogram can group travel times into ten-minute intervals.
-
Density curve
A density curve models a continuous distribution with nonnegative height and total area 1. Probability over an interval is the area under the curve across that interval, rather than its height at a single point. For example, an interval containing one quarter of the total area has probability 0.25.
-
Symmetric distribution
A symmetric distribution has approximately matching shapes on either side of its center. Symmetry alone does not establish that a distribution is Normal. For example, a uniform distribution over a centered interval is symmetric but has a flat rather than bell-shaped density.
Read more: Symmetric distribution in the captured Statistics reading →
-
Mean
The mean is a measure of center often called an average. For a finite data set, the arithmetic mean is the sum of the values divided by their number; for a random variable, the mean is its probability-weighted expected value when that value exists. Means can be pulled toward extreme values and are not generally resistant. For example, the arithmetic mean of 2, 4, and 9 is 5.
-
Standard deviation
Standard deviation measures spread around the mean using squared deviations and a square root. A sample standard deviation uses the sum of squared deviations divided by one less than the sample size before taking the square root. For example, a larger standard deviation of travel times indicates greater variability, in the original time units.
Read more: Standard deviation in the captured Statistics reading →
-
Variance
Variance is the square of the standard deviation. It measures spread in squared units, with the precise averaging rule depending on whether it describes a sample or a probability distribution. For example, a standard deviation of 3 centimeters corresponds to a variance of 9 square centimeters.
-
68–95–99.7 rule
For a Normal distribution, approximately 68%, 95%, and 99.7% of values lie within one, two, and three standard deviations of the mean. The rule is an approximation for Normal or sufficiently bell-shaped data, rather than for every distribution. For example, a Normal model with mean 50 and standard deviation 5 places about 95% of values between 40 and 60.
-
Observation
An observation is a recorded value or set of values for an individual or occasion. The individual may be a person, object, or event rather than a human subject. For example, one plant’s measured height is an observation in a plant-growth study.