2.1 Surveys and Sampling
Section Overview
Populations and Samples
Suppose we want to investigate the spending habits of recent college graduates in Urbanopolis. Ideally, we would take a census, a poll that would contact the entire Urbanopolis college undergraduate population. Of course, we might not possess the time, money, or resources to accomplish this. Instead, we focus on creating a survey—a list of questions for a sample, or a smaller group selected to represent the population.
How to Sample Poorly
How can we choose a sample that we can trust to represent the population? The first step is to not fall into any of these common pitfalls:
Convenience Sampling - This is when you choose individuals who are easiest to reach.
Bias - The design of a statistical study shows bias if it systematically favors certain outcomes.
Voluntary Sampling - A voluntary response sample consists of people who choose whether to participate in the survey.
Additionally, there are two types of errors, sampling errors and nonsampling errors, that can negatively affect our survey:
- Sampling Errors - Sampling begins with a sampling frame, or a list of every individual in the population from which we will draw our sample. However, because a list of the entire population is rarely available, most samples suffer from some degree of undercoverage.
- Nonsampling Errors - One of the most serious sources of bias in sample surveys is nonresponse, when individuals chosen for the sample can’t be contacted or refuse to participate. Or response bias, which comes from a systematic pattern of incorrect responses. One way to elicit response bias is through manipulating the wording in the survey.
How to Sample Well: Random Sampling
In a voluntary sample, people can choose whether or not to respond. In a convenience sample, the interviewer is the one making the choice. In both instances, personal choice is involved, which produces bias. To eliminate bias, we introduce random sampling, or using chance to select a sample from the population. By extension, a simple random sample (SRS) of size consists of individuals from the population chosen in such a way that every set of individuals has an equal chance to be the sample actually selected.
Another type of random sampling is stratified random sampling, which is used when when the individuals within each stratum are similar to one another, but are very different from other strata, otherwise known as “similar within, but different between.”
Another common alternative is cluster sampling, Unlike stratified random sampling, clusters are “different within, but similar between.”
We also have systematic random sampling, where every th individual of a population is selected for the sample.
A word of caution before we get into the Example Problem: “simple random sample” has the same initials as both “stratified random sample” and “systematic random sample”, but only simple random sample gets the SRS abbreviation.
Example Problem 2.1.1
Interactive 2.1.1 Example 2.1.1
Frame 1 of 3
Engineers: Seats 1–20. Programmers: Seats 21–40. Marketers: Seats 41–60. Scientists: Seats 61–80. Financial Analysts: Seats 81–100. Legend: Simple Random Sampling, Cluster Sampling, Stratified Random Sampling, Systematic Random Sampling, Convenience Sampling, Voluntary Sampling. Open full-size image S0149Frame 2 of 3
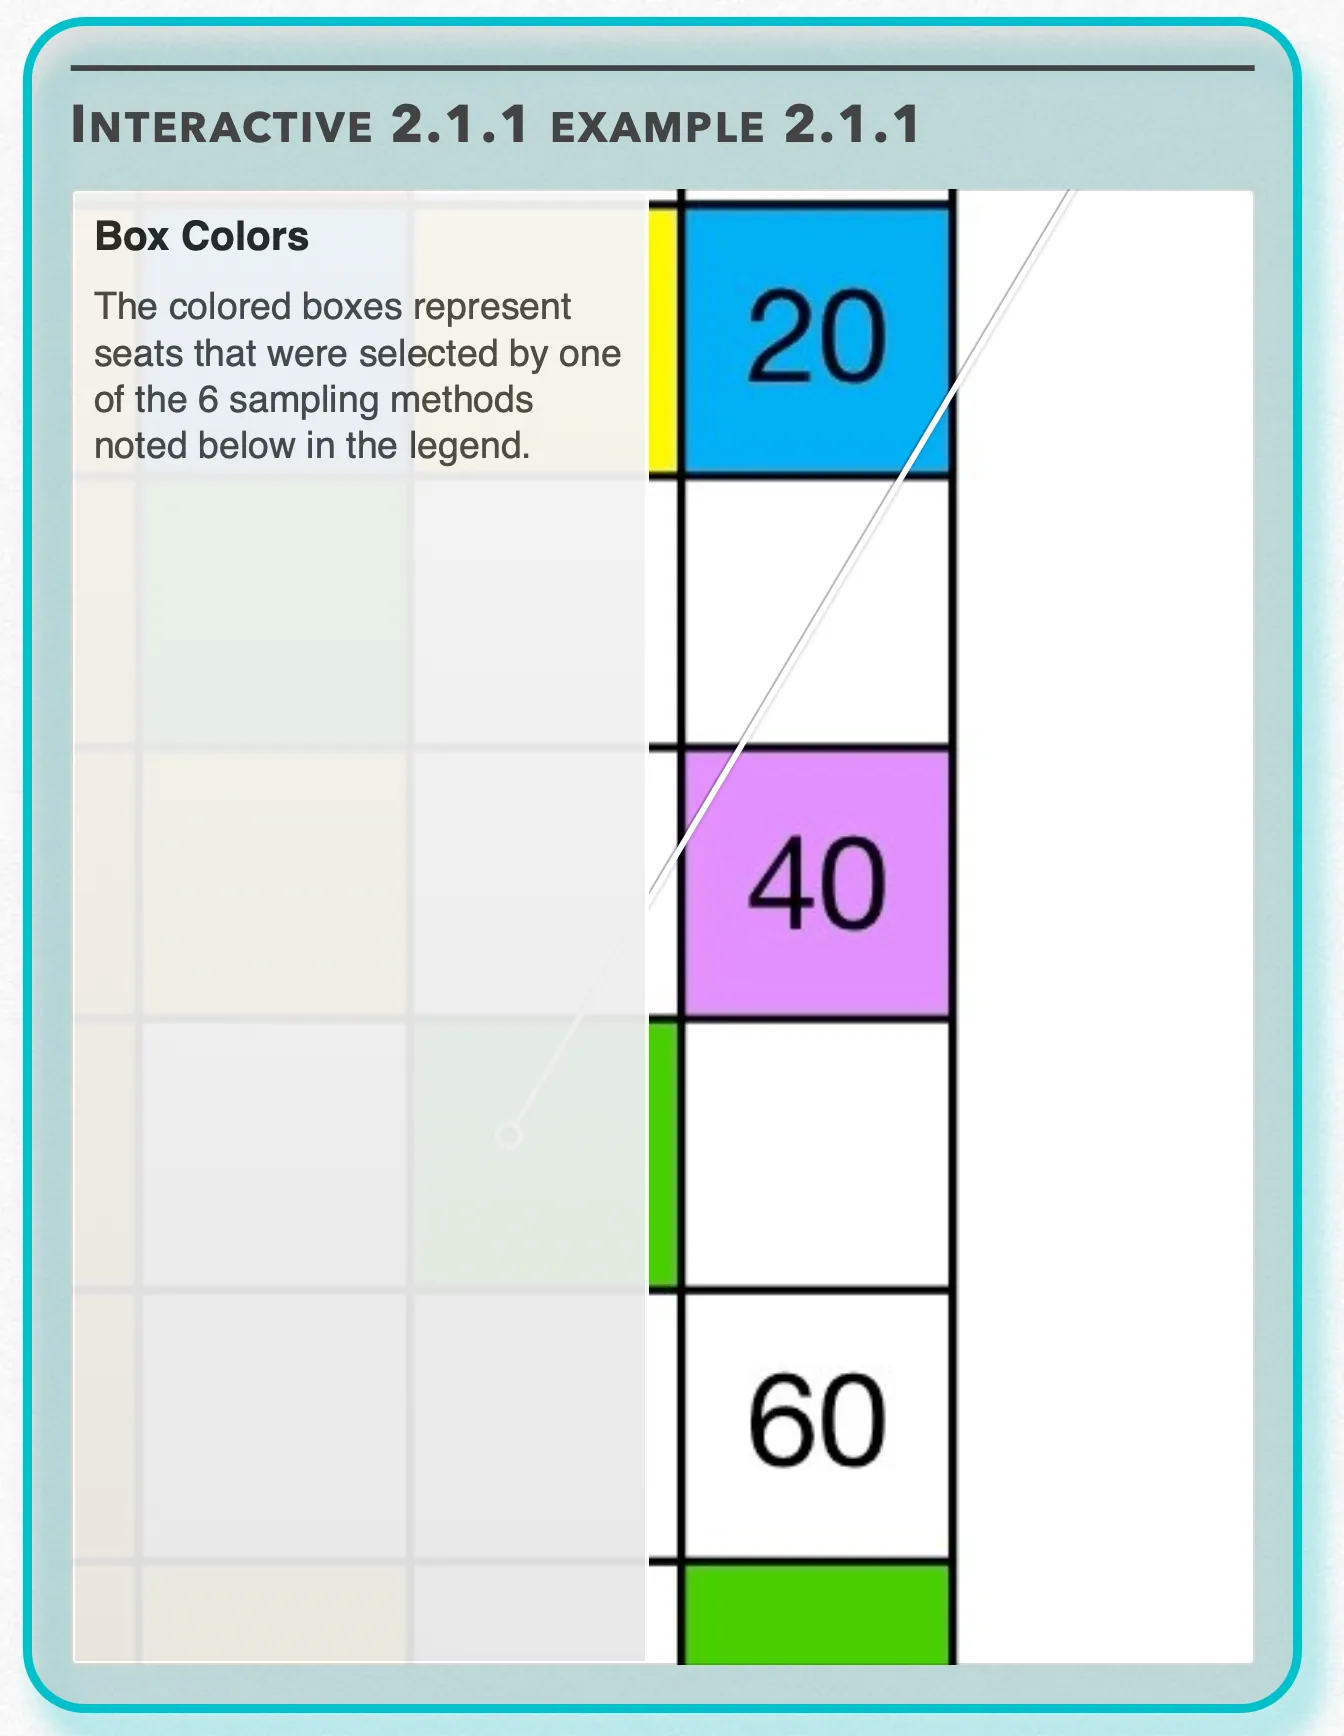
Box Colors — The colored boxes represent seats that were selected by one of the 6 sampling methods noted below in the legend. Open full-size image S0150Frame 3 of 3
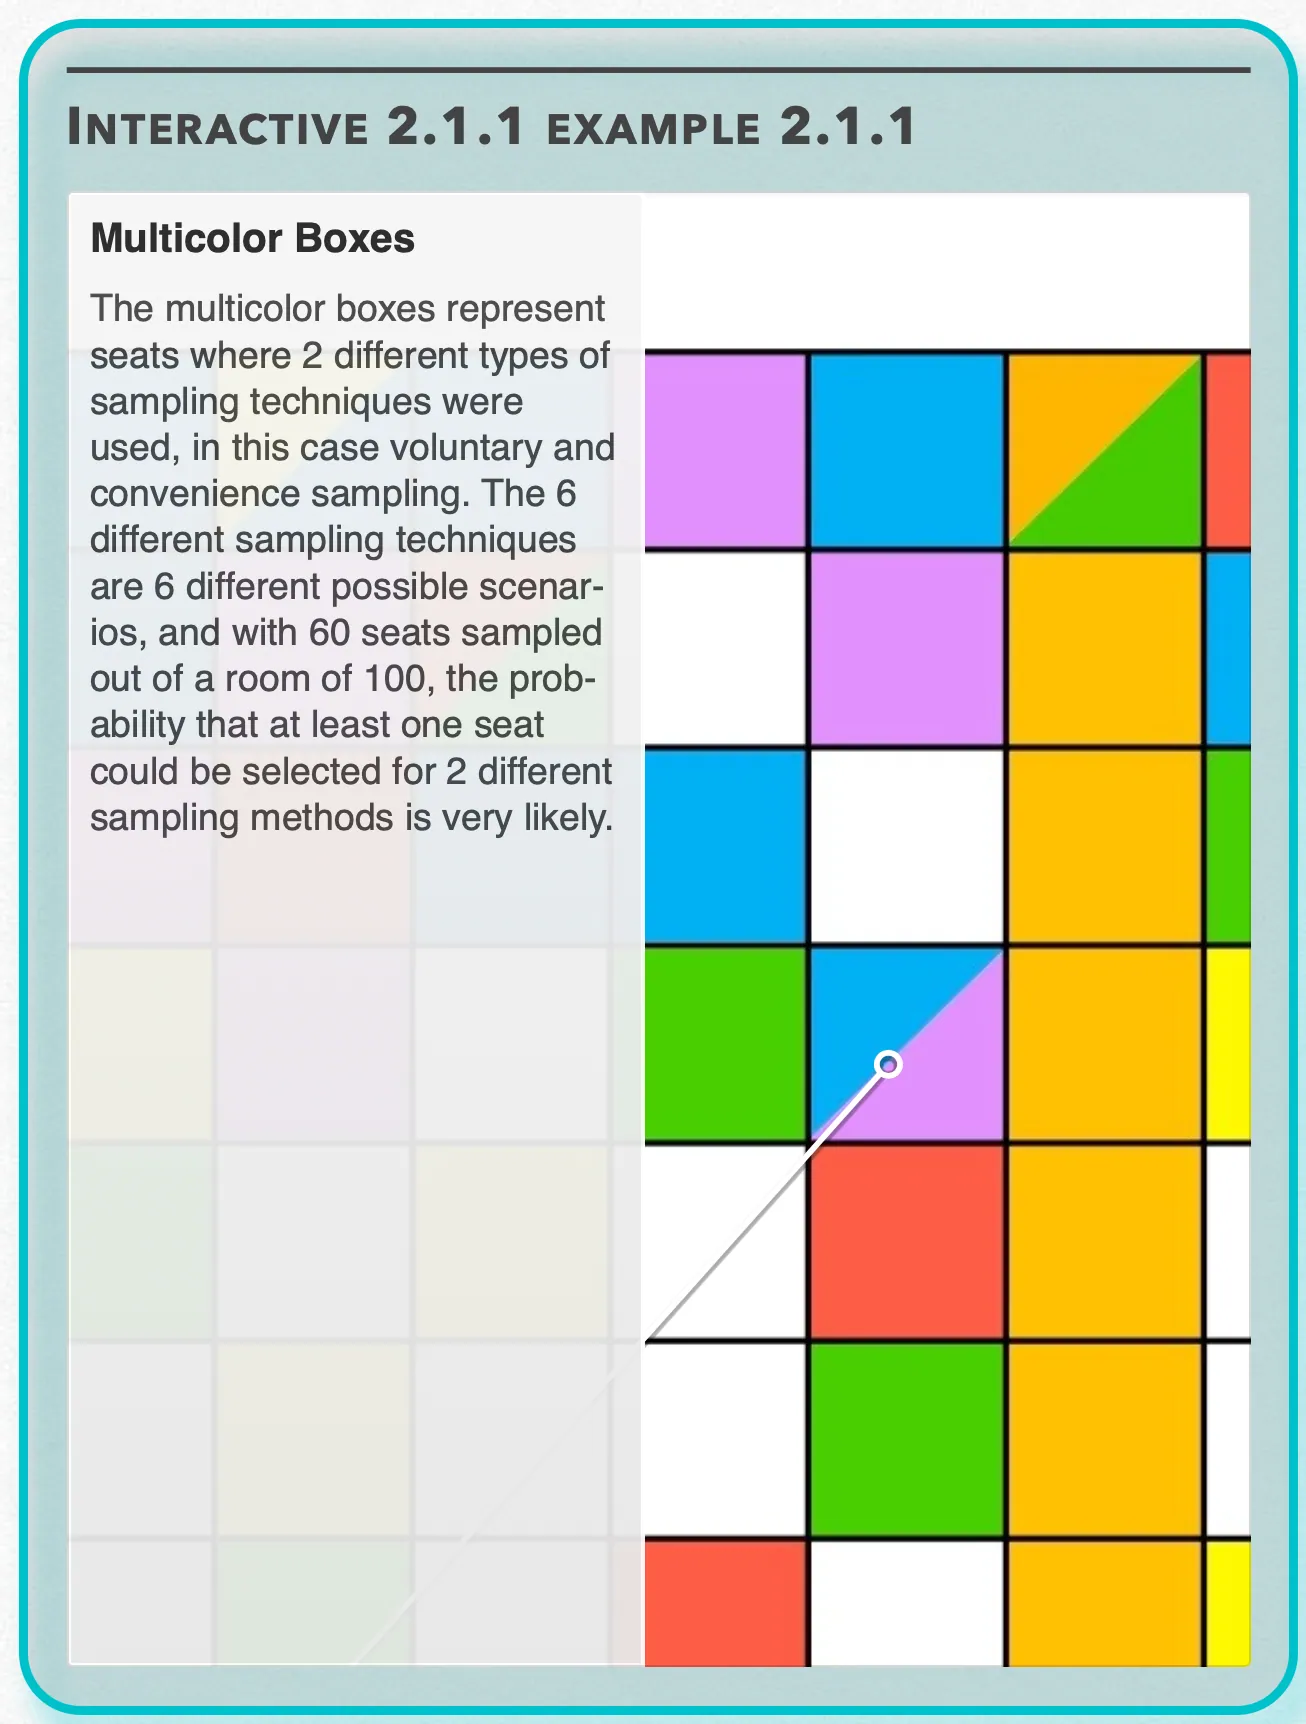
Multicolor Boxes — The multicolor boxes represent seats where 2 different types of sampling techniques were used, in this case voluntary and convenience sampling. The 6 different sampling techniques are 6 different possible scenarios, and with 60 seats sampled out of a room of 100, the probability that at least one seat could be selected for 2 different sampling methods is very likely. Open full-size image S0151
Capture provenance
Filename capture times, with no recorded timezone. Frames above follow the original gallery positions.
- · S0149 · displayed frame 1
Screenshot 2026-10-05 at 3.47.22 PM.png - · S0150 · displayed frame 2
Screenshot 2026-10-05 at 3.47.32 PM.png - · S0151 · displayed frame 3
Screenshot 2026-10-05 at 3.47.39 PM.png
The selections displayed in the seating diagram are:
| Sampling method | Legend color | Selected seats |
|---|---|---|
| Simple Random Sampling | Red | 1, 8, 14, 23, 46, 65, 80, 82, 96, 99 |
| Cluster Sampling | Orange | 7, 17, 27, 37, 47, 57, 67, 77, 87, 97 |
| Stratified Random Sampling | Yellow | 3, 19, 32, 38, 44, 53, 68, 76, 81, 94 |
| Systematic Random Sampling | Green | 7, 14, 21, 28, 35, 42, 49, 56, 63, 70 |
| Convenience Sampling | Blue | 2, 3, 4, 6, 12, 18, 20, 24, 25, 36 |
| Voluntary Sampling | Purple | 5, 13, 16, 22, 33, 36, 40, 61, 79, 86 |
Example Problem 2.1.1 — Recorded answer
a) Remember that cluster sampling gives samples that are “different within but similar between.” If we were to take multiple cluster samples, each cluster that we take would be of a column, where each column would similarly capture 2 individuals from each of the 5 different jobs. We need only acquire one cluster sample to get our 10 individuals. To choose which cluster to sample from, we randomly choose a number from 1 to 10 and the number that is chosen will be the column that will be used to acquire our sample. In Interactive 2.1.1, this number is 7.
b) Stratified random sampling gives samples that are “similar within but different between.” If we were to perform stratified random sampling, each strata or department that we take would similarly have 2 randomly selected individuals within each of the different jobs for a total of 5 strata.
Each strata spans two rows and could potentially capture anybody within that span, so to choose the individuals, we could randomly choose two numbers from 1 to 20, return these two numbers to the pile, and repeat this 5 times. The 10 numbers that are chosen will be the seat numbers individuals used to acquire our sample. In Interactive 2.1.1, these numbers would be: 3, 19, 12, 18, 4, 13, 8, 16, 1, and 14, going down the rows respectively.
c) Simple random sampling in this problem would involve randomly selecting 10 numbers from 1–100. Unlike cluster or stratified random sampling, an SRS does not guarantee an equal number from each job, as can be seen in Interactive 2.1.1, where 3 of the individuals are Engineers, 1 is a Programmer, 1 is a Marketer, 2 are Scientists, and 3 are Financial Analysts.
d) Systematic random sampling is when you take every th individual from the population for your sample. If we want to select 10 individuals, then we want to ensure that . In Interactive 2.1.1, , where every individual selected is a multiple of 7 up to the 75th seat. Systematic sampling in this scenario might not be the most effective method because it fails to select any of the Financial Analysts sitting in the back rows.
e) Convenience sampling involves choosing individuals that are easiest for the surveyor to reach. When examining Interactive 2.1.1, it appears that all of the individuals selected using this method were all seated in the first 4 rows, which likely means that the individuals that came in first to the meeting and sat near the front of the room were selected. This sampling method invites bias; for instance: individuals that come in first to a meeting might be ambitious and work harder, leading to results that suggest progress is going better than it really is.
f) Voluntary sampling involves letting the individuals choose whether to take the survey. If we were to look at Interactive 2.1.1 without knowing that purple boxes represented the individuals chosen from a voluntary sample, then we could easily mistake it for simple random sampling, since the voluntary samples are also scattered randomly throughout the room. Make no mistake, though - voluntary sampling, although it may appear random, is also a biased method. For instance, maybe the individuals that volunteered to take the survey were more vocal about various setbacks being encountered in the project, which could lead to results that suggest progress is going worse than it really is!
Pop Quiz 2.1.1
Glossary and deeper reading · 14 refreshers
These editorial refreshers supplement the reading. Definitions and examples are added guidance; original source wording and recorded answers remain in their original context.
-
Census
A census attempts to collect data from every individual in the defined population. It avoids sampling variability from selecting only a subset, but can still have coverage, response, and measurement errors. For example, asking every enrolled student about transportation is a census of that enrollment.
-
Population
A population is the full set of individuals or measurements a study aims to describe. It must be defined clearly before deciding whether a sample supports generalization. For example, all students enrolled in a particular school this year form a population.
-
Sample
A sample is the subset of a population actually studied. How it is selected matters for the conclusions that can be drawn about the population. For example, 60 selected students may be a sample from a school’s full enrollment.
-
Convenience sample
A convenience sample includes individuals who are easiest to reach. Easy access does not ensure that the sample represents the target population. For example, surveying only students sitting nearest the classroom door is convenience sampling.
-
Statistical bias
Statistical bias is a systematic tendency to favor some outcomes or miss a target value. For an estimator, bias is its long-run average estimate minus the parameter it estimates. For example, a survey that consistently misses evening workers may systematically misrepresent commuting patterns.
-
Voluntary response sample
A voluntary response sample consists of people who choose to respond to an open invitation. People with strong opinions may participate more often than others, creating selection bias. For example, an unrestricted online poll can overrepresent those especially interested in the issue.
-
Survey
A survey collects information by asking individuals questions. Its quality depends on the sample design, question wording, and responses received. For example, a school can survey selected families about their transportation needs.
-
Sampling error
Sampling error is the difference arising because a sample rather than the entire population is observed. Random sampling variability is distinct from systematic coverage or response bias. For example, two properly selected random samples can produce different mean commuting times purely by chance.
-
Nonsampling error
Nonsampling errors arise from problems other than selecting a finite sample. They include inaccurate answers, missed individuals, recording mistakes, and faulty measurement. For example, entering a recorded age incorrectly can affect a census as well as a sample survey.
-
Sampling frame
A sampling frame is the list or other operational source from which a sample is selected. It may differ from the target population if some members are omitted or listed incorrectly. For example, a current enrollment list can serve as a frame for selecting students.
-
Undercoverage
Undercoverage occurs when some groups in the target population have little or no opportunity to enter the sample. A large sample does not remove bias caused by an incomplete sampling frame. For example, using only a landline directory misses people who have no listed landline.
-
Nonresponse
Nonresponse occurs when selected individuals do not supply usable responses. It can cause bias if nonrespondents differ systematically from respondents on the study’s variables. For example, selected students with long commutes may be less likely to answer a transportation survey.
-
Response bias
Response bias is a systematic pattern of inaccurate or influenced answers. Wording, interviewer behavior, memory, and social pressure can affect what people report. For example, a leading question can encourage respondents to favor a proposed school policy.
-
Stratum
A stratum is a nonoverlapping subgroup used in stratified sampling. A stratified design samples within every stratum rather than selecting only some groups. For example, each grade level can be a stratum in a school survey.