Correlation: Linear Strength, Direction, and Limits
An upward or downward pattern is easier to compare across settings when it has a numerical summary. The correlation coefficient describes a particular kind of pattern: linear association between two quantitative variables. Its strength is its usefulness and also its limitation.
What Correlation Measures
The correlation coefficient, written , summarizes the strength and direction of a linear association. It is unit-free and always lies between −1 and 1, inclusive. A positive r indicates positive association; a negative r indicates negative association. The closer r is to either endpoint, the stronger the linear association. A value near zero indicates weak linear association.
Exactly means no linear association; it does not rule out a curved relationship. Exactly or means a perfect positive or negative linear association: all plotted observations follow a non-horizontal straight-line relationship, assuming both variables vary. There is no valid correlation value of 1.2 or −1.4. The sign gives direction, while the distance from zero gives linear strength. A negative r is not automatically weaker than a positive r.
| Correlation | Interpretation of linear association |
|---|---|
| −0.92 | Strong negative |
| −0.20 | Weak negative |
| 0 | None, although a non-linear pattern may exist |
| 0.92 | Strong positive |
| 1 or −1 | Perfect linear association |
These strength words are descriptions rather than universal cutoff rules. Report context and inspect the plot as well. Because r has no units, measuring the same distances in centimeters rather than meters leaves r unchanged under that positive unit conversion. In contrast, a regression slope can change because its units change. A steep line can have the same correlation as a shallow line.
Worked Comparison
Two groups relate practice hours to target scores. Group A has r=−0.88; group B has r=0.63. Group A has the stronger linear association because 0.88 is closer to 1 than 0.63 is. Its direction is negative, while group B’s is positive. Saying that 0.63 is “larger” does not answer which relationship is stronger.
Check the Form Before the Number
A correlation close to −1 or 1 does not necessarily make a linear model appropriate. A curve can have a high correlation because its overall movement is consistently upward or downward, yet its shape systematically departs from a line. A small correlation also does not mean “the variables have no relationship.”
Worked Example: A High Correlation on a Curve
For the generated pairs (1,1),(2,4),(3,9),(4,16), technology gives . The association is positive and its linear correlation is high, but the plotted shape bends upward. The points follow y=x squared exactly. A curved model can describe that shape more faithfully than a straight line. The decision to use a linear model requires the scatterplot’s form, not just a favorable r.
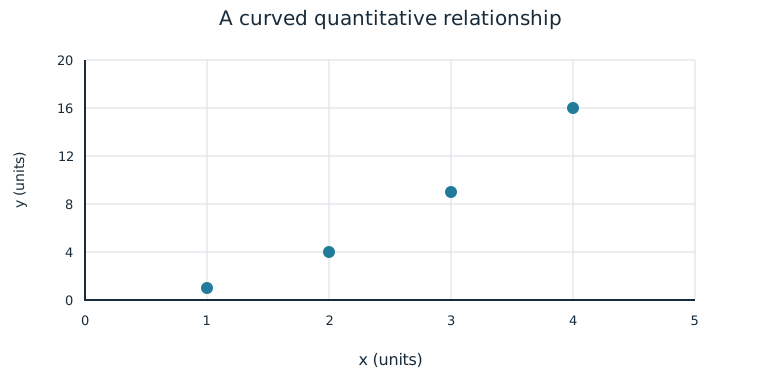
There can also be a strong U-shaped pattern with r=0. For example, the pairs (−2,4),(−1,1),(0,0),(1,1),(2,4) have no linear association because the two arms balance; they still follow a precise curve. Keep “linear” in any interpretation of zero correlation.
Association and Cause
A perceived or real relationship does not mean that changing one variable causes the other to change. Correlation does not necessarily imply causation. A third variable may influence both, individuals may select their own conditions, or the observed group may differ in other ways. The coefficient itself does not tell how the data were collected.
Suppose on warmer days a park sells more ice cream and rents more bicycles. A positive correlation between ice cream sales and bicycle rentals would not show that buying an ice cream causes a bicycle rental. Temperature and visitor numbers offer alternative explanations. In another study, random assignment of a treatment may support a causal conclusion when the design is appropriate; that conclusion comes from the study design, not from r alone.
Worked Claim
An observational sample finds r=0.81 between weekly practice hours and target score. It supports a positive linear association in that sample, subject to the scatterplot’s form and any unusual observations. It does not prove that assigning an additional hour of practice will cause any particular member’s score to rise. Prior experience could affect both chosen practice time and score. Interpret the evidence actually collected rather than a different experiment that did not occur.
Independent Practice
Use the information in each question to make your own calculation, representation, or argument. Explain what your result means in its setting.
Original generated practice for the Fall 2026 course.
Glossary and deeper reading · 10 refreshers
These editorial refreshers supplement the reading. Definitions and examples are added guidance; original source wording and recorded answers remain in their original context.
-
Correlation coefficient
Pearson’s correlation coefficient measures the direction and strength of a linear relationship between two quantitative variables. It ranges from −1 to 1, and a value near 0 does not rule out a strong curved relationship. For example, points closely following a decreasing straight line have correlation near −1.
Read more: Correlation coefficient in the captured Statistics reading →
-
Quantitative variable
A quantitative variable records a numerical count or measurement for each individual. Differences between its values have a meaningful numerical interpretation. For example, the number of books borrowed and the mass of a backpack are quantitative variables.
Read more: Quantitative variable in the captured Statistics reading →
-
Positive association
Two variables have a positive association when larger values of one tend to accompany larger values of the other. Individual observations need not follow the tendency perfectly. For example, taller trees may tend to have wider trunks.
Read more: Positive association in the captured Statistics reading →
-
Negative association
Two variables have a negative association when larger values of one tend to accompany smaller values of the other. The tendency can be linear or curved and does not by itself show cause and effect. For example, higher fuel efficiency may accompany lower fuel use per mile.
Read more: Negative association in the captured Statistics reading →
-
Observation
An observation is a recorded value or set of values for an individual or occasion. The individual may be a person, object, or event rather than a human subject. For example, one plant’s measured height is an observation in a plant-growth study.
-
Regression slope
A regression slope is the predicted change in the response for a one-unit increase in the explanatory variable. Its units are response units per explanatory-variable unit. For example, a slope of 2 centimeters per week predicts 2 additional centimeters of height for each additional week.
Read more: Regression slope in the captured Statistics reading →
-
Causation
Causation means that changing one condition produces a change in an outcome. Association alone is insufficient because confounding and other explanations may account for the pattern. For example, a well-conducted randomized fertilizer experiment can support a causal conclusion about growth in its study setting.
-
Random assignment
Random assignment uses chance to allocate experimental units to treatment conditions. It tends to balance other influences across groups and supports causal inference in a well-conducted experiment, without guaranteeing identical groups. For example, shuffled labels can assign plants to two fertilizer treatments.
Read more: Random assignment in the captured Statistics reading →
-
Treatment
A treatment is a specific condition imposed on an experimental unit. In a multifactor experiment, a treatment is a combination of factor levels. For example, low fertilizer with eight hours of light is one treatment combination.
-
Scatterplot
A scatterplot displays paired values of two quantitative variables as points. The horizontal coordinate represents one variable and the vertical coordinate represents the other. For example, plotting hours studied against test scores helps reveal a pattern without establishing causation.