2.1 Seeing Relationships Between Categorical Variables
Two Labels for Each Person
At a community workshop, each participant has two categorical labels: membership status and workshop time. A two-way table, also called a contingency table, preserves their relationship. Each interior cell counts participants with both labels. Entries can be frequencies (counts) or relative frequencies (proportions); always check which kind is shown.
| Day | Evening | Weekend | Total | |
|---|---|---|---|---|
| Member | 20 | 10 | 10 | 40 |
| Nonmember | 10 | 30 | 20 | 60 |
| Total | 30 | 40 | 30 | 100 |
The table is complete for these 100 participants. Its 20 in the first cell describes members attending by day, not all members and not all day participants. Dividing every cell by 100 would make a joint-relative-frequency table without changing the underlying data.
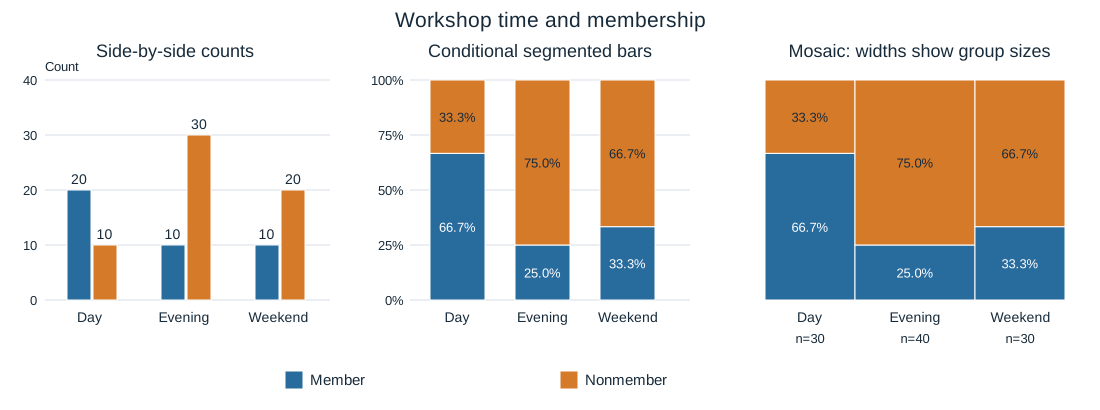
Three graphs can display the same relationship in different ways. In a side-by-side bar chart, member and nonmember counts sit next to one another at each time. A segmented bar chart splits a same-height bar into conditional proportions: each time’s participants total 100%. A mosaic plot also splits each time into proportions, but gives larger groups more width. In this mosaic, area is proportional to the joint relative frequency.
Worked Comparison: Counts or Composition?
The side-by-side chart answers “How many?” Evening has the most participants, 40, and 30 of them are nonmembers. The segmented chart answers “What proportion within each time?” The member proportions are for Day, for Evening and for Weekend. The mosaic preserves these heights and shows Evening’s larger group with a wider column.
These differences support an association between membership and workshop time in this participant population. The membership distributions are not the same across the time categories. A member is a much larger share of Day attendees than of Evening attendees. The table supplies the denominators; the conditional bars make the distribution differences immediately visible.
Suppose someone claims, “The larger Evening group means Evening has the largest proportion of members.” The claim confuses a total with a composition. The table has only 10 Evening members among 40 Evening participants, versus 20 among 30 Day participants. The displayed conditional proportions reject the claim. A useful justification names the groups, gives the relevant numbers and connects them to the claim; it does not merely say a graph “looks different.”
The plots have distinct strengths. Counts retain group size; segmented bars make proportions easier to compare; mosaic widths retain group sizes while heights show composition. No representation adds new observations. Also, this association alone does not establish that changing a participant’s membership would cause a different workshop-time choice. Keep the conclusion tied to the variables and participants actually represented.
Try It Yourself
The following original practice applies the ideas above to a fresh setting. Show the reasoning requested in each part. Answers and task-specific rubrics are on the separate solutions page.
Original generated practice for the Fall 2026 course.
Glossary and deeper reading · 5 refreshers
These editorial refreshers supplement the reading. Definitions and examples are added guidance; original source wording and recorded answers remain in their original context.
-
Two-way table
A two-way table organizes counts for combinations of two categorical variables. The cells show combinations, while row and column totals summarize each variable separately. For example, a table can classify students by grade level and whether they walk to school.
Read more: Two-way table in the captured Statistics reading →
-
Relative frequency
Relative frequency is a group’s count divided by the total count. It can be written as a proportion or multiplied by 100 to give a percentage. For example, 8 choices out of 20 have relative frequency 0.4, or 40%.
Read more: Relative frequency in the captured Statistics reading →
-
Frequency table
A frequency table lists the number of observations in each category or numerical interval. Its counts add to the total number of observations when the groups do not overlap and cover all observations. For example, a table can record how many students chose each lunch option.
Read more: Frequency table in the captured Statistics reading →
-
Bar graph
A bar graph uses separate bars to compare category counts or proportions. The bar lengths or heights encode the values, and category order need not be numerical. For example, separate bars can compare the number of votes for three lunch options.
-
Joint relative frequency
A joint relative frequency divides one cell’s count by the overall table total. It describes the proportion of all individuals who have both listed characteristics. For example, 6 grade-11 walkers among 30 students give a joint relative frequency of 20%.
Read more: Joint relative frequency in the captured Statistics reading →