Linear Predictions: Substitute, Interpret, and Check the Range
A scatterplot may suggest a straight-line relationship, but a numerical prediction requires an equation. Regression uses an explanatory value that you know to predict a response that you do not yet know. Keep that direction straight: predicting y from x is different from solving backward for an x that would produce a desired y.
From Linear Form to a Prediction
If the relationship between x and y appears linear, a linear regression model can approximate it. The model is a linear equation using the explanatory variable x to predict the response variable y. Write the predicted response as y-hat, , because it is a prediction rather than an observed response:
Here a is the y-intercept, b is the slope of the regression line, and x is the explanatory value supplied to the model. Identify the variables and units before substitution. Observations can differ from their predictions even when a line is a useful summary of the relationship.
Worked Example: Delivery Time
A delivery service records route distance x in kilometers and delivery time y in minutes. Its generated observations are:
| Distance (km) | 1 | 2 | 4 | 6 | 8 | 10 |
|---|---|---|---|---|---|---|
| Time (min) | 11 | 12 | 19 | 22 | 29 | 32 |
The pattern is approximately straight and upward. Suppose the service uses the stated model . This is a supplied model, not a claim that this equation is the least-squares fit to the displayed observations. Its intercept is 8 minutes, slope is 2.5 minutes per kilometer, and explanatory value is route distance.
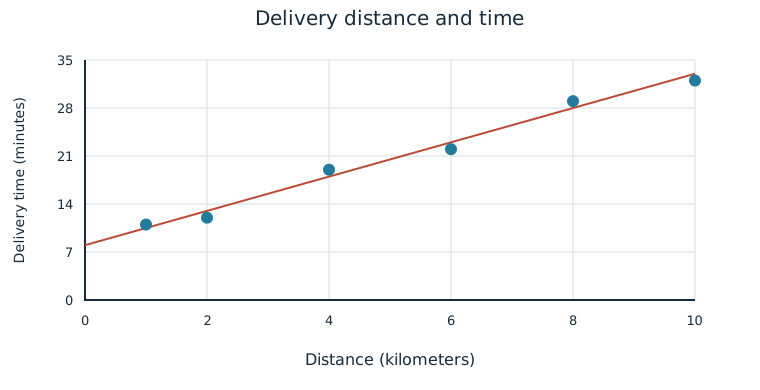
For a 4-kilometer route, substitute x=4:
The model predicts an 18-minute delivery. The displayed 4-kilometer observation is 19 minutes, so its observed time differs from the prediction. Do not replace y-hat by the observed value or reverse the equation to report a distance when a time was requested. A prediction is a model result for a specified explanatory value.
Interpolation and Extrapolation
Interpolation predicts a response for an explanatory value within the interval of x-values used to determine the regression line. Extrapolation uses an explanatory value beyond that interval. The observed response range does not decide which kind of prediction you are making; compare the proposed x with the observed x interval.
For the stated delivery model, an 8-kilometer prediction is interpolation because 8 is within 1–10 kilometers. It gives minutes. A 20-kilometer prediction gives 58 minutes but is extrapolation because 20 lies beyond the observed distance interval. The arithmetic still works; the evidence for extending the relationship is weaker. A 50-kilometer extrapolation is still farther beyond the data and generally less reliable than a nearby extrapolation.
Extrapolation can fail because the process changes. Long routes may use highways, require additional stops, or enter a different service area. Those mechanisms are not learned by observing only short routes. Interpolation also carries uncertainty; a fitted line does not guarantee an individual’s observed response.
Check Form, Range, and Context
Before reporting a prediction, inspect whether the observed form is approximately linear, identify explanatory and response variables, substitute the requested explanatory value, and state the predicted response with units. Then classify the prediction by the observed x-range and explain any material limitation.
If the data bend strongly, a convenient line can give systematically inappropriate predictions even for x-values inside the observed interval. For example, the complete pairs (1,1),(2,4),(3,9),(4,16) trace a curve. Interpolation only locates the input within the observed interval; it does not fix a poorly chosen model form. A useful prediction report combines arithmetic with the relationship’s shape and scope.
Independent Practice
Use the information in each question to make your own calculation, representation, or argument. Explain what your result means in its setting.
Original generated practice for the Fall 2026 course.
Glossary and deeper reading · 7 refreshers
These editorial refreshers supplement the reading. Definitions and examples are added guidance; original source wording and recorded answers remain in their original context.
-
Scatterplot
A scatterplot displays paired values of two quantitative variables as points. The horizontal coordinate represents one variable and the vertical coordinate represents the other. For example, plotting hours studied against test scores helps reveal a pattern without establishing causation.
-
Least-squares regression
Least-squares regression fits a line predicting a response from an explanatory variable. The fitted line minimizes the sum of squared vertical residuals between observed and predicted responses. For example, a fitted line can predict a plant’s height from its age, within the range of observed ages.
Read more: Least-squares regression in the captured Statistics reading →
-
Explanatory variable
An explanatory variable is used to predict or explain variation in a response variable. In an experiment, researchers deliberately assign values or treatments related to an explanatory variable. For example, assigned study time could be an explanatory variable when test score is the response.
Read more: Explanatory variable in the captured Statistics reading →
-
Regression intercept
A regression intercept is the line’s predicted response when the explanatory variable is zero. It may lack a useful contextual interpretation when zero lies outside the relevant data range. For example, an intercept predicts height at age zero even if measurements were collected only for mature plants.
Read more: Regression intercept in the captured Statistics reading →
-
Regression slope
A regression slope is the predicted change in the response for a one-unit increase in the explanatory variable. Its units are response units per explanatory-variable unit. For example, a slope of 2 centimeters per week predicts 2 additional centimeters of height for each additional week.
Read more: Regression slope in the captured Statistics reading →
-
Extrapolation
Extrapolation uses a model to predict beyond the range of explanatory values used to fit it. A pattern observed within the data range may not continue outside that range. For example, extending a short-term plant-growth line far into the future may give unrealistic heights.
Read more: Extrapolation in the captured Statistics reading →
-
Response variable
A response variable records the outcome being studied. Its relationship to an explanatory variable can be investigated without assuming that the explanatory variable causes it. For example, plant height is a response when researchers compare fertilizer treatments.
Read more: Response variable in the captured Statistics reading →