How to Use
This original textbook reading covers part of the AP topic. Follow the AP course outline for complete topic instruction and practice.
This is a Gallery
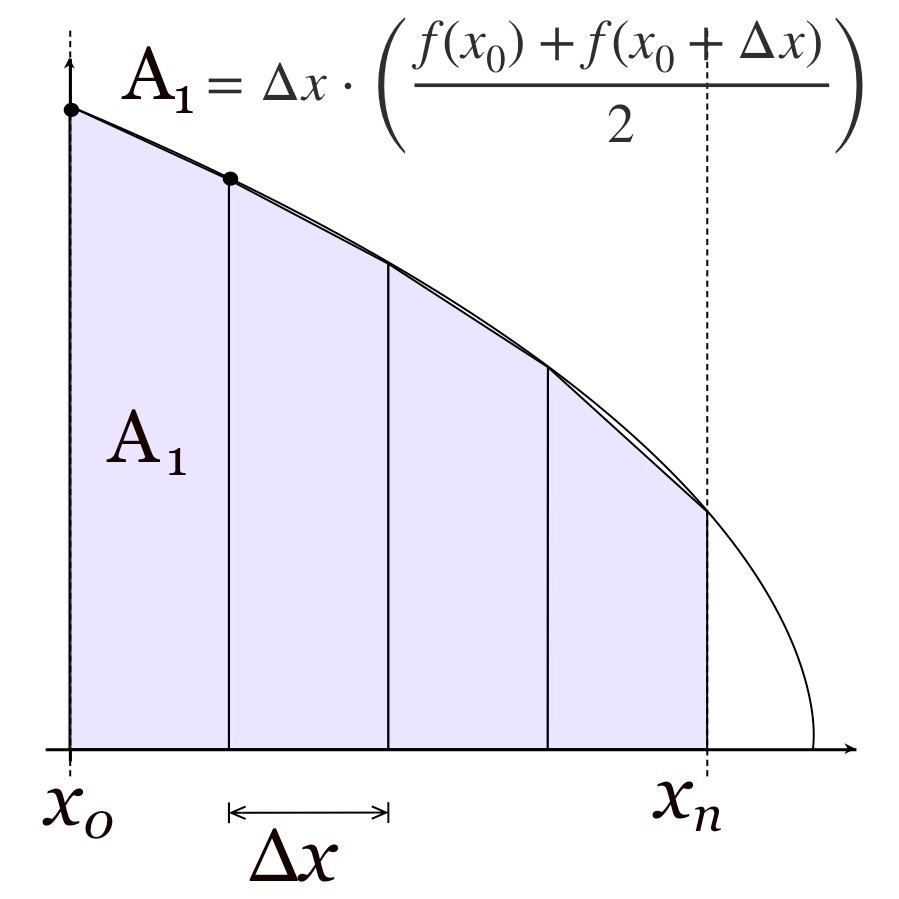
Read all original image captions
Image 1
Image 2
Image 3
Image 4
Image 5
0 - Legal Notices
Copyright © - All written and illustrated content contained within this work, except the source code of some proprietary software, is protected under copyright ©, with all rights licensed to the legal entity Omninox, LLC, copyright 2012 - 2013. All rights reserved.
Contributors:
Yatit Thakker - Author and Editor
Jessie Richards - Illustrator
Jake Yap and Laurence Vincent - Suggested including a glossary in the second edition.
Privacy Policy - Any information sent to Omninox Publishing, such as name and email address, using built-in widgets such as the sketchpad, will be held in confidentiality. Your information is used to fulfill your requests and communicate with you, operate, support and improve our content, products and services. We do not sell, rent or provide your personal information to unaffiliated third parties. Apple, Inc. is not held responsible for information you disclose to Omninox, LLC.
1 - Gallery
This is an Interactive Image
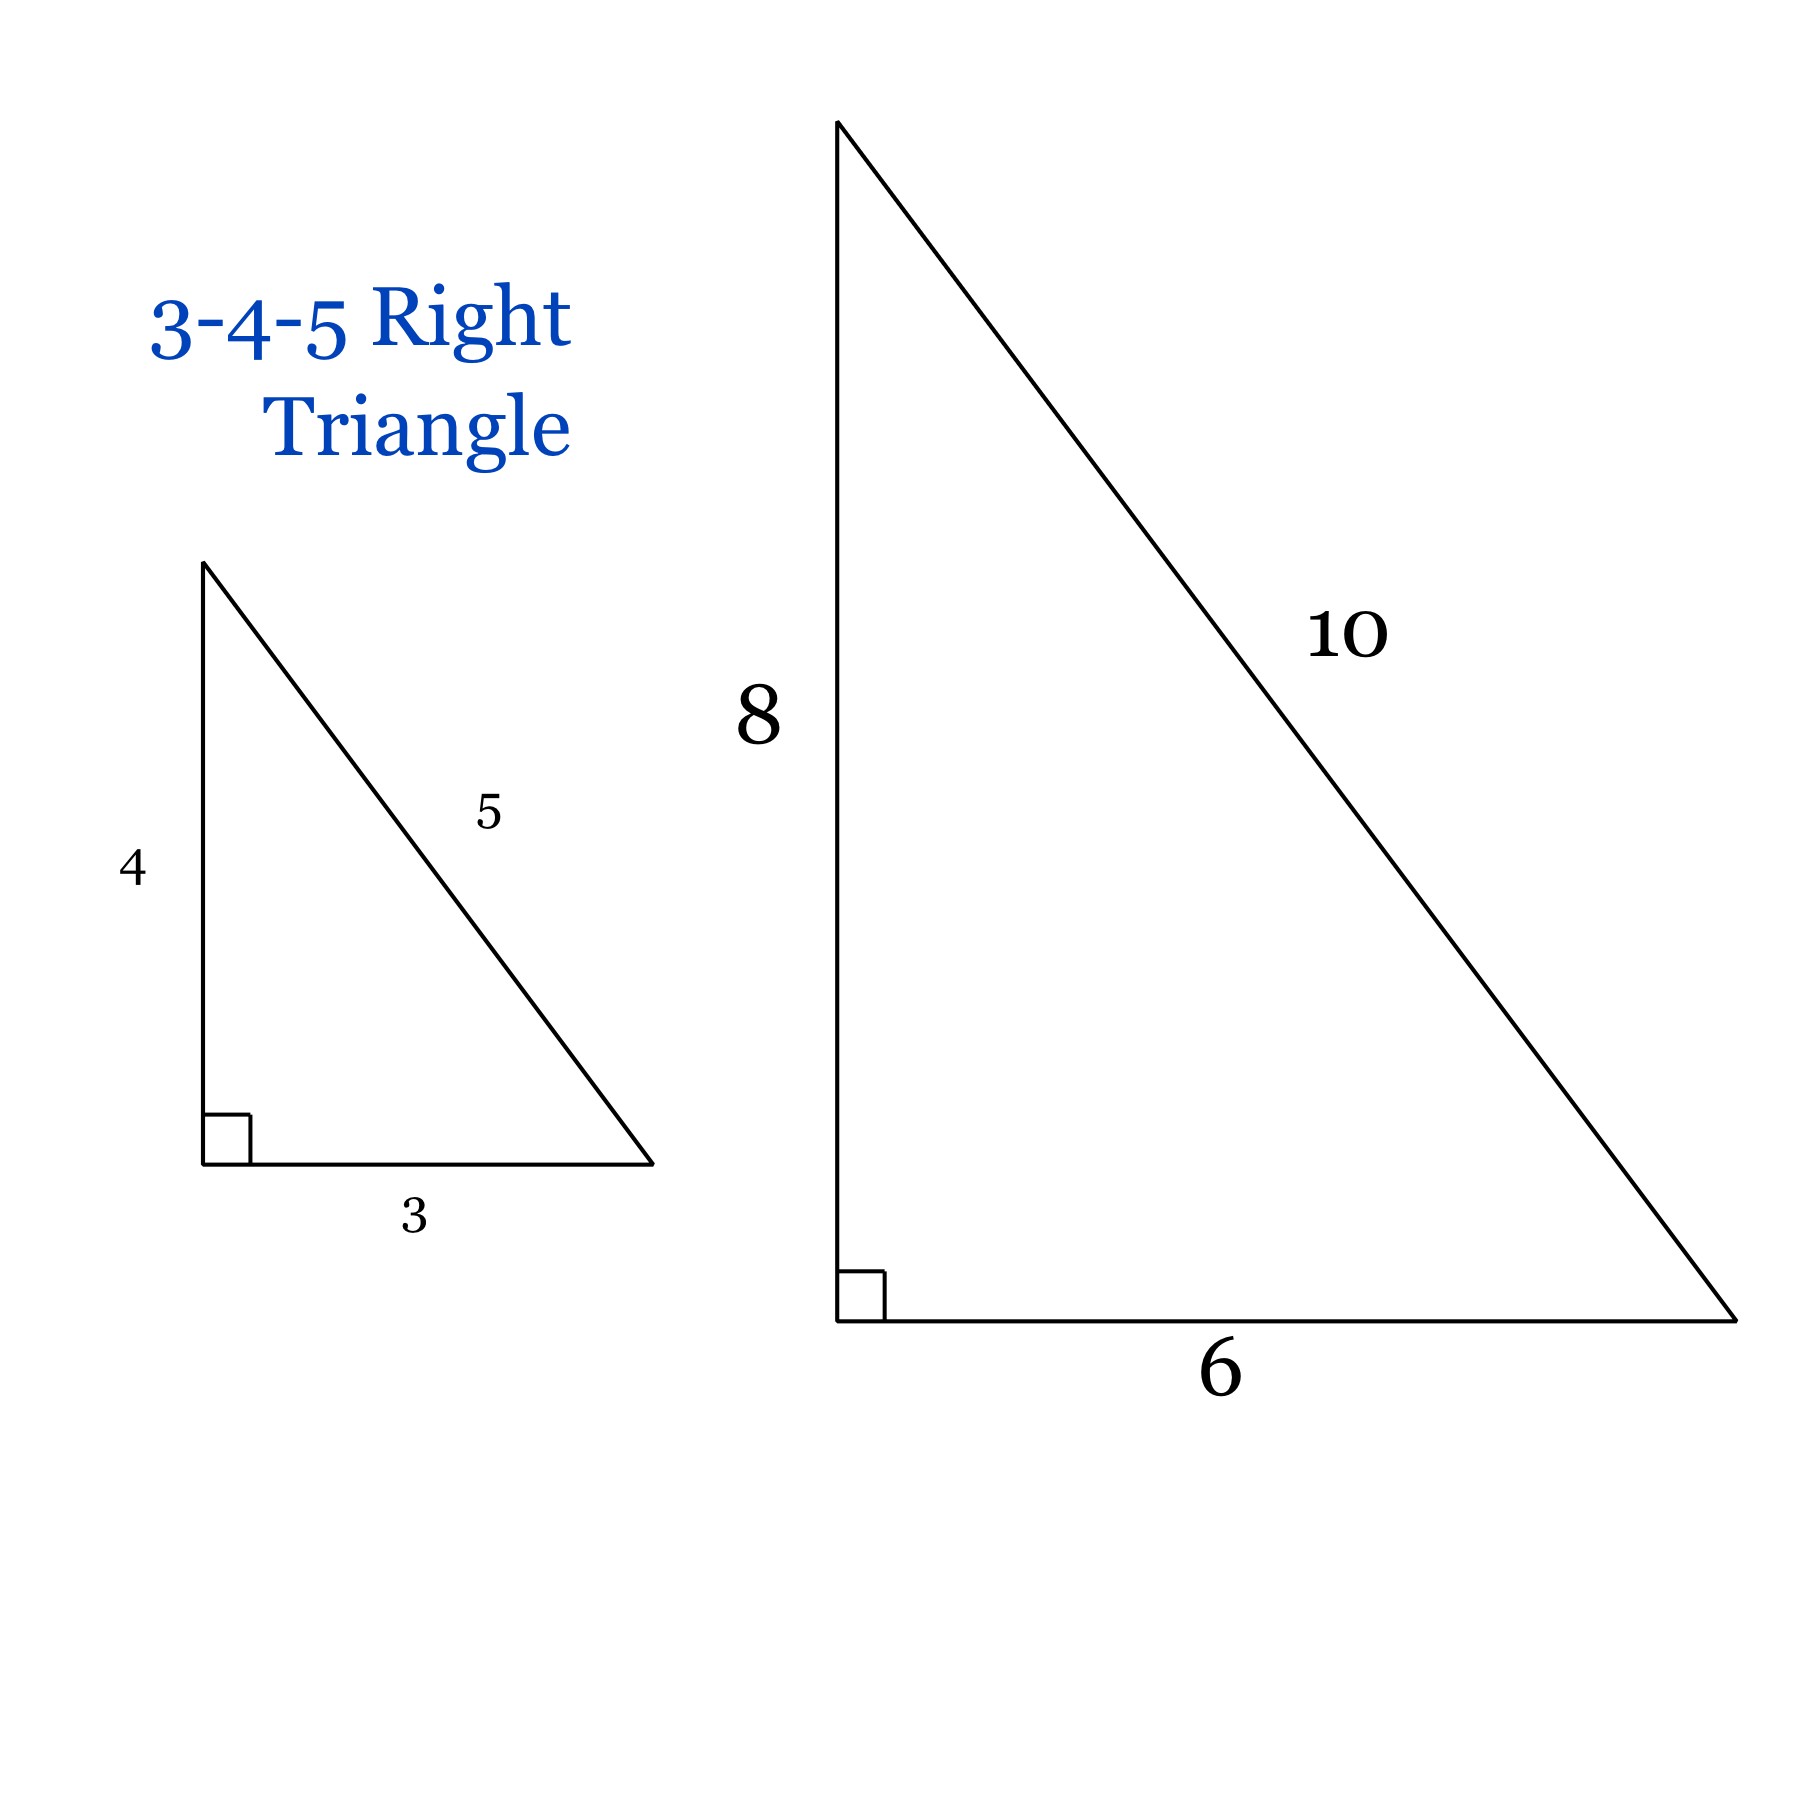
Read all original figure notes
Touch Here Second
Touch Here First
This is a Sketchpad
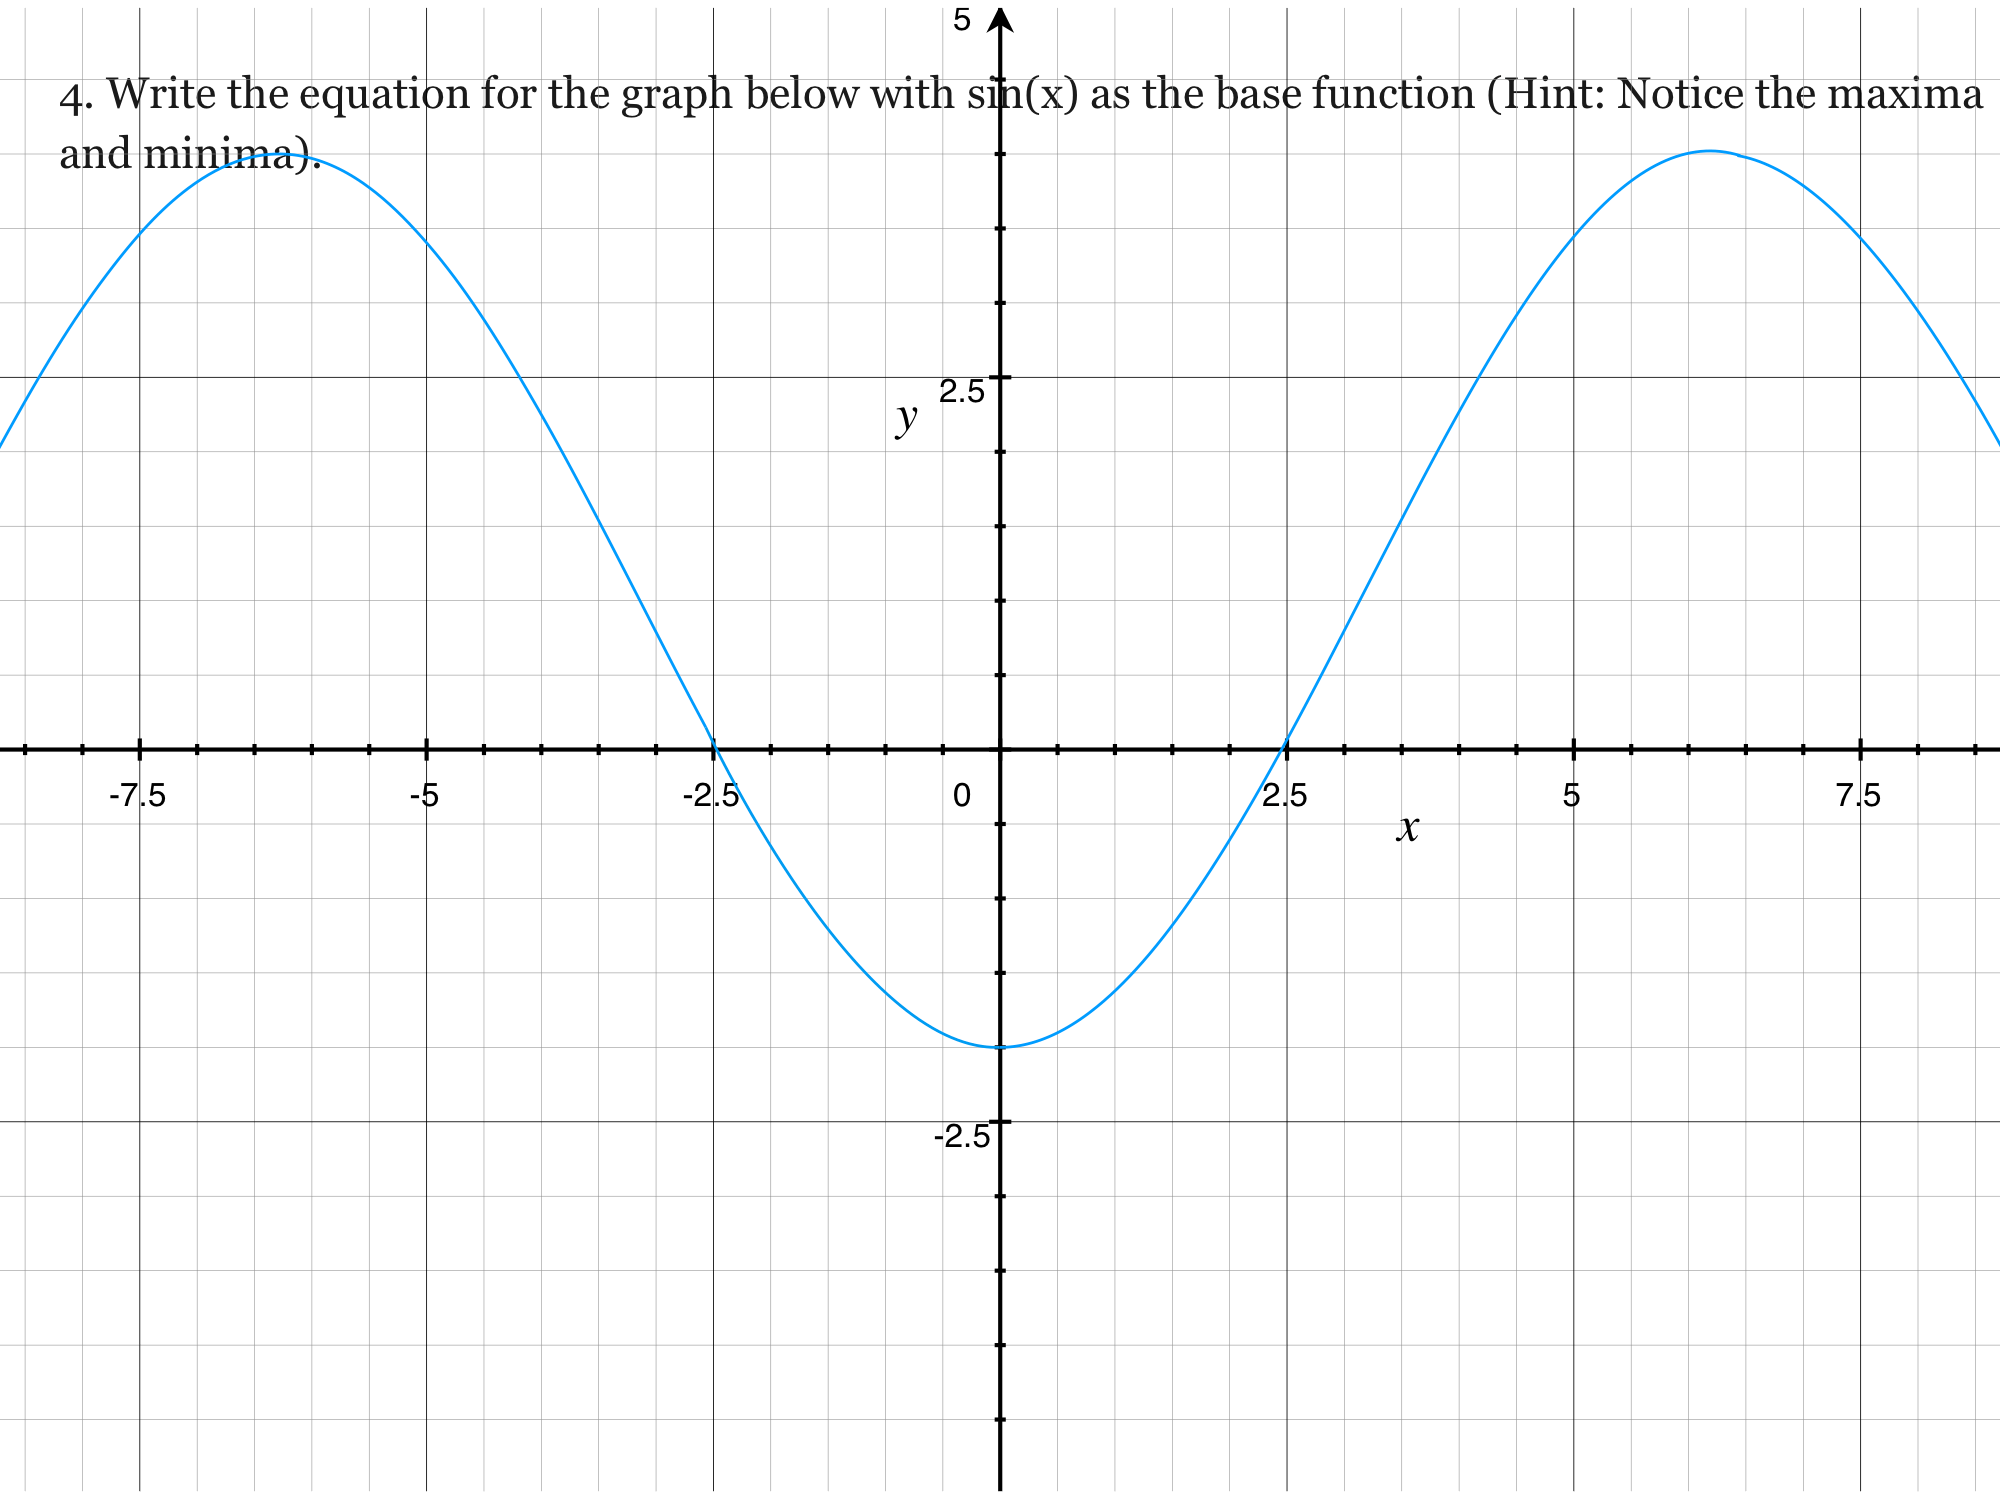
Source sinusoidal graph
A blue sinusoidal curve is drawn on a Cartesian grid. The horizontal axis is x and the vertical axis is y. Visible labeled x-values include −7.5, −5, −2.5, 0, 2.5, 5 and 7.5; visible labeled y-values include −2.5, 0, 2.5 and 5.
The curve has a trough on the y-axis at approximately y=−2 and neighboring crests at approximately y=4, near x=−6.3 and x=6.3. It crosses the x-axis near x=−2.5 and x=2.5. The plotted wave is symmetric about the y-axis.
Coordinates not printed next to the extrema are approximate readings from the source raster. No exact symbolic crest positions or period are printed; this description does not supply an unprinted exact period or an equation.
Drawing is temporarily unavailable. Work on paper if needed, then record your reasoning here.
Saving written working requires JavaScript. Keep your work on paper or in your own notes; the source problem above remains available.
4 - Sketchpad
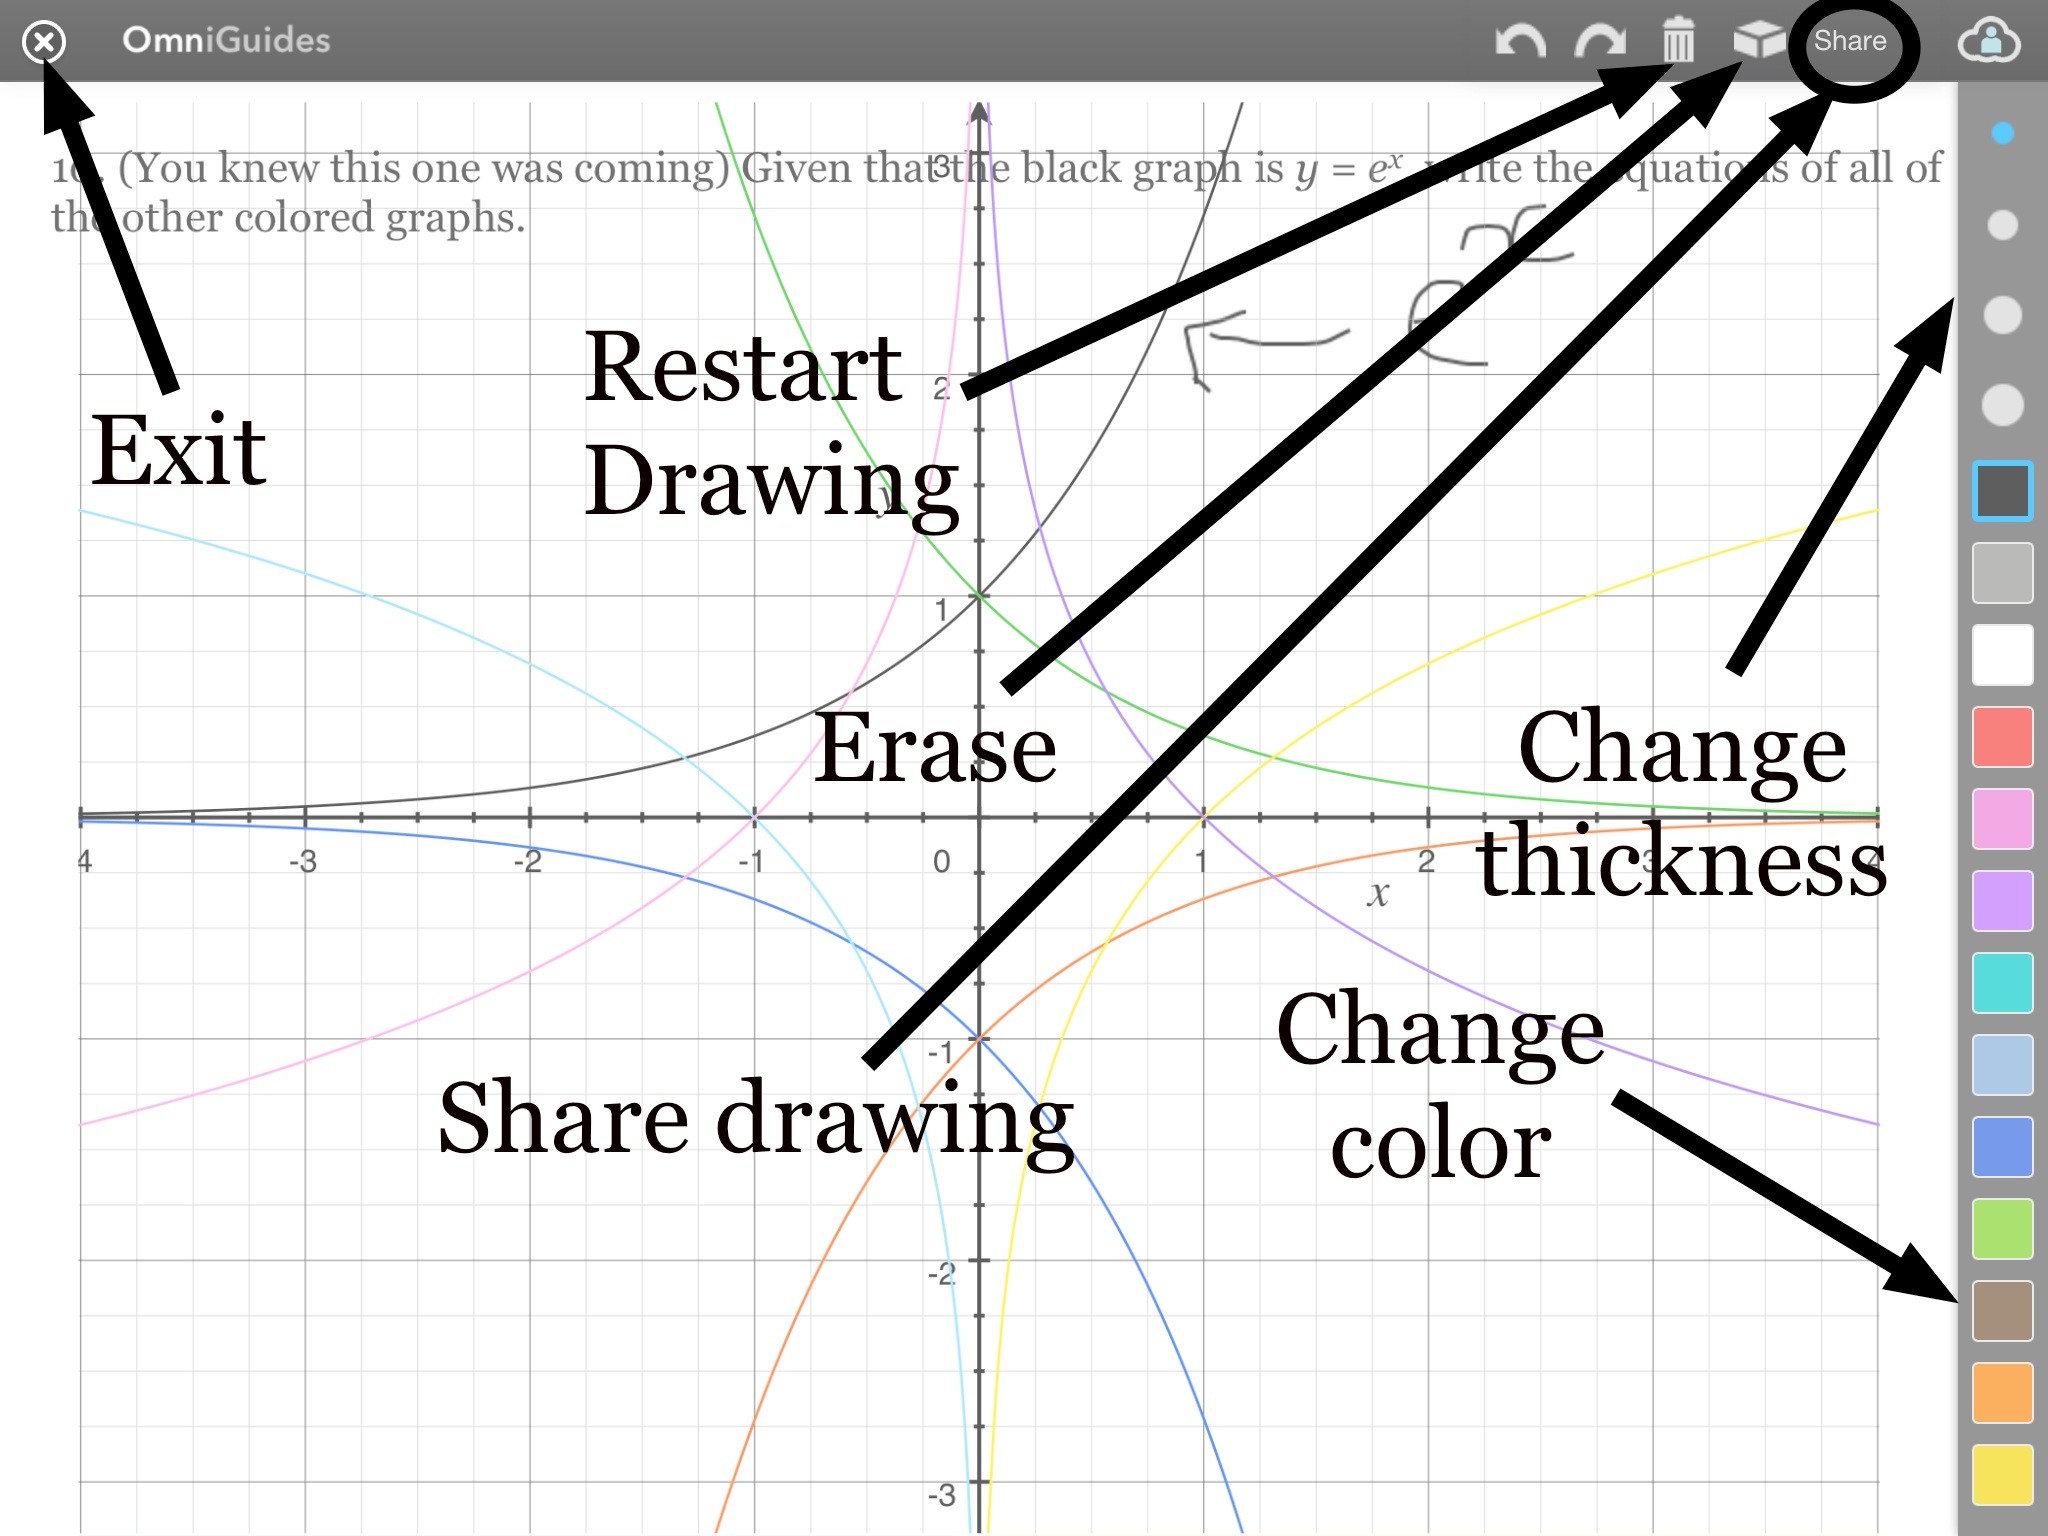
The sketchpad is usable when you see the image below, usually at the end of a chapter for chapter problems:
Touch the picture to begin sketching. You can do a lot of neat stuff on your next screen.
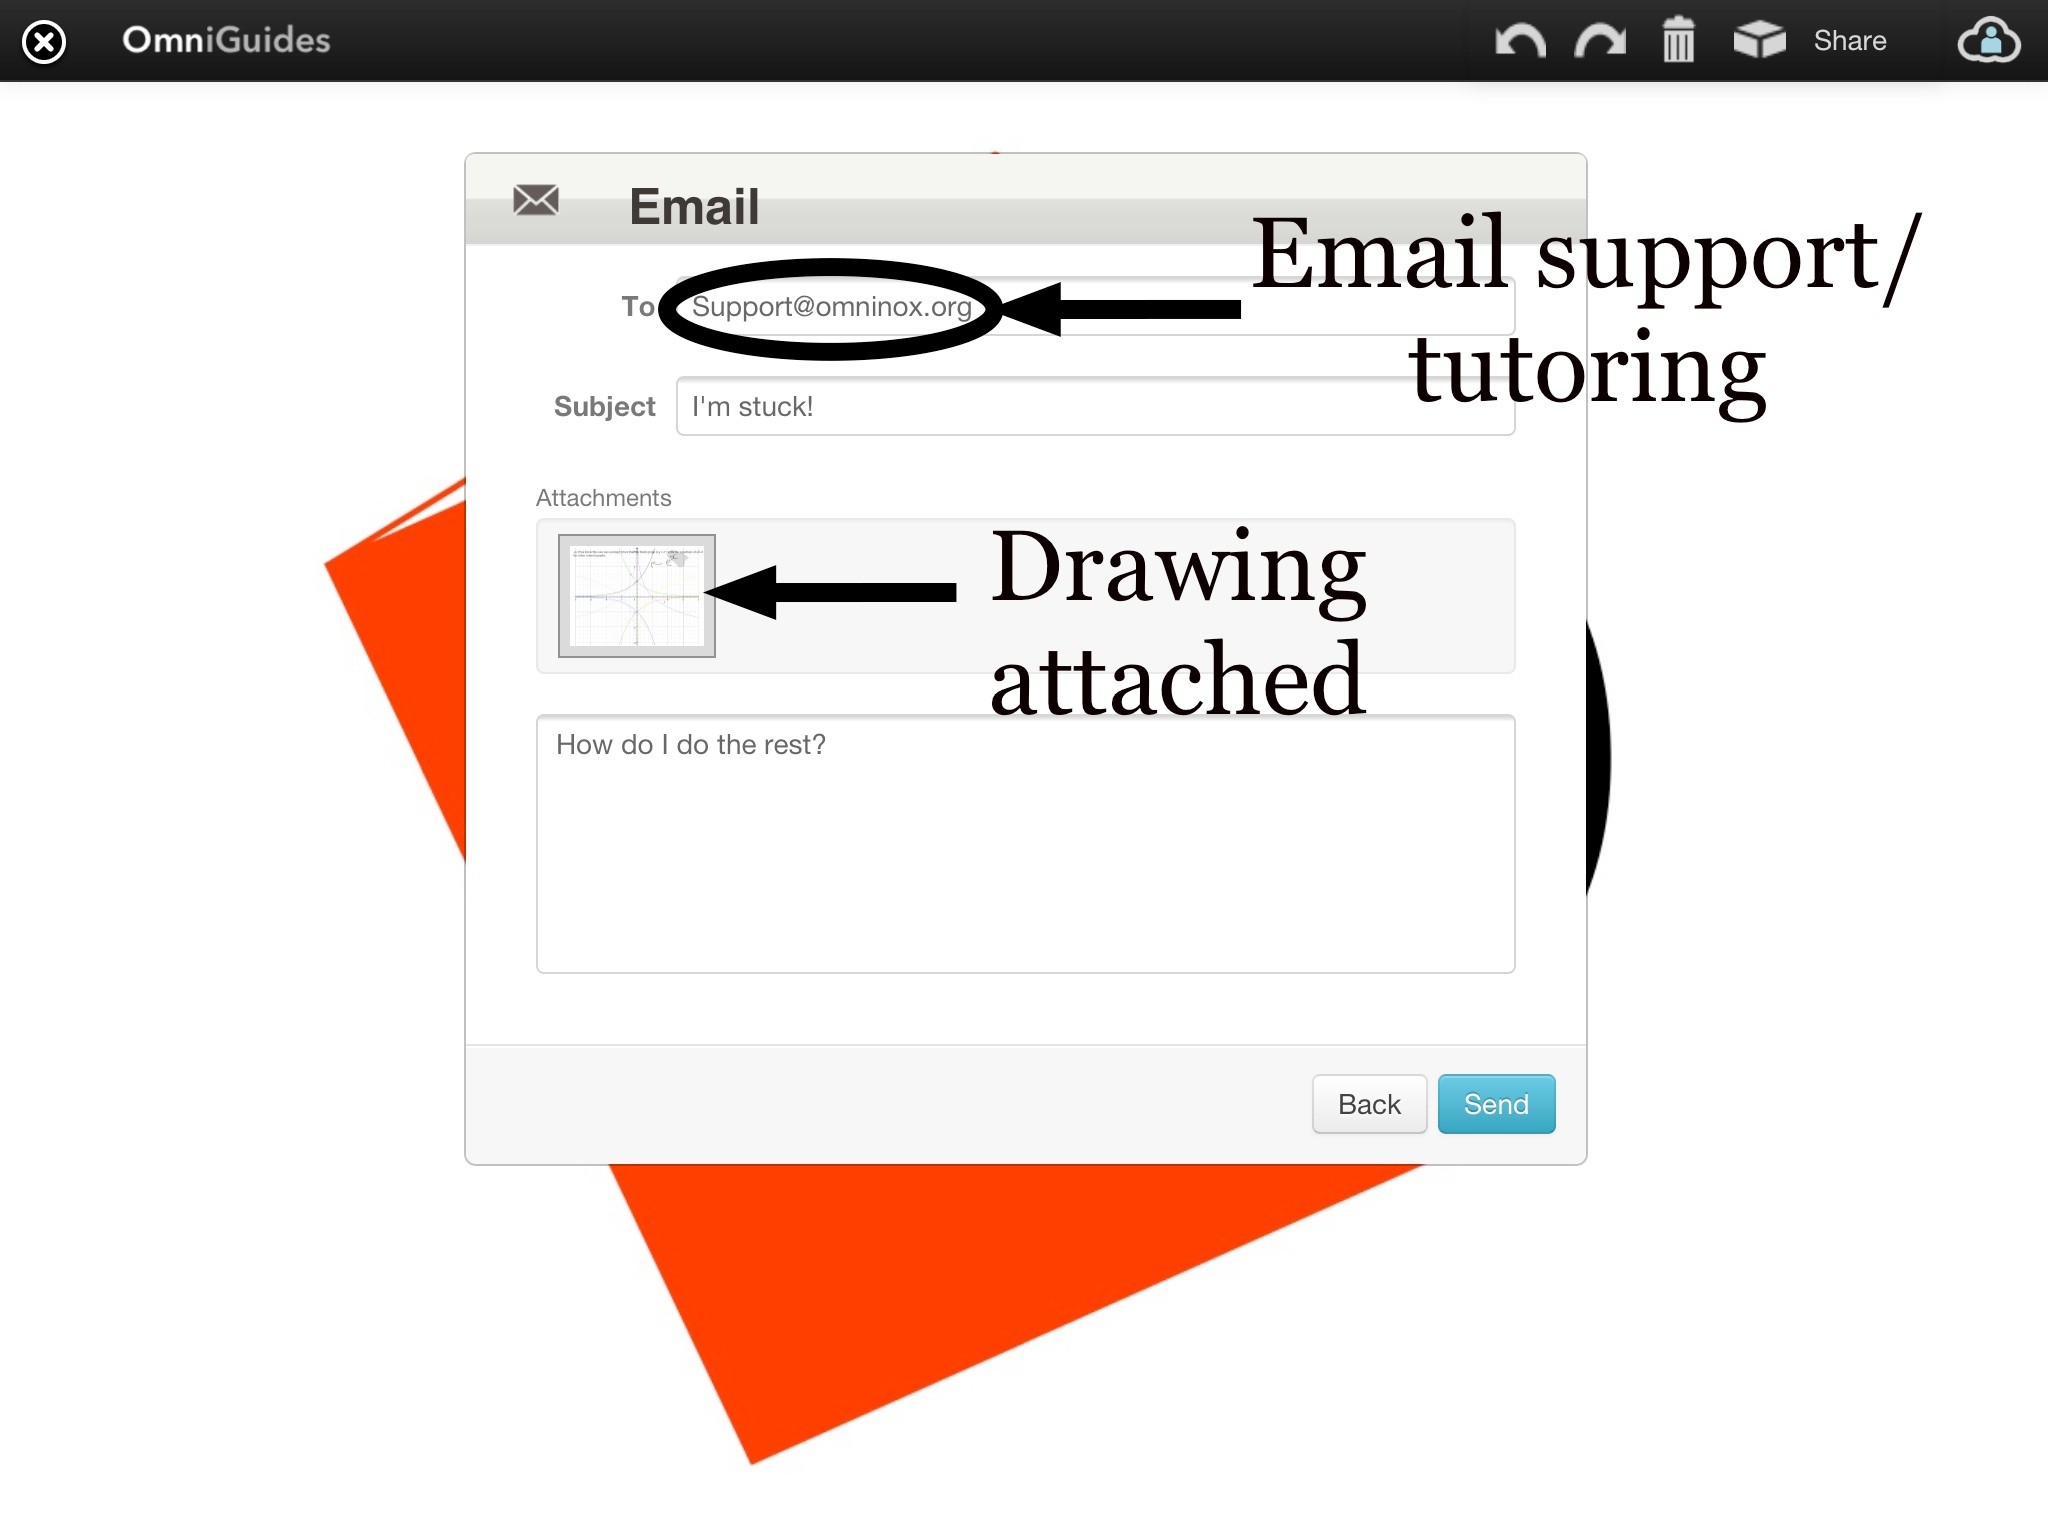
Requirements for email support:
- You must have attempted the problem.
- Your question may only be about a chapter problem.
- The subject of the email must include the chapter number and problem number that you are sending.
These requirements help ensure that you get a prompt and customized response. They also make sure that you are being challenged, and learning something about Calculus along the way.
In addition to help with chapter problems, you can also email [email protected] if you notice any errors or wish that a section was explained in a clearer way.
5 - Glossary
The glossary is used for providing definitions and reference values for things such as the unit circle, logarithm rules, and trigonometric identities. Glossary words are bolded and sometimes bolded and underlined. Touch one of the words “unit circle,” “logarithm rules,” or “trigonometric identities” above to see what I mean.
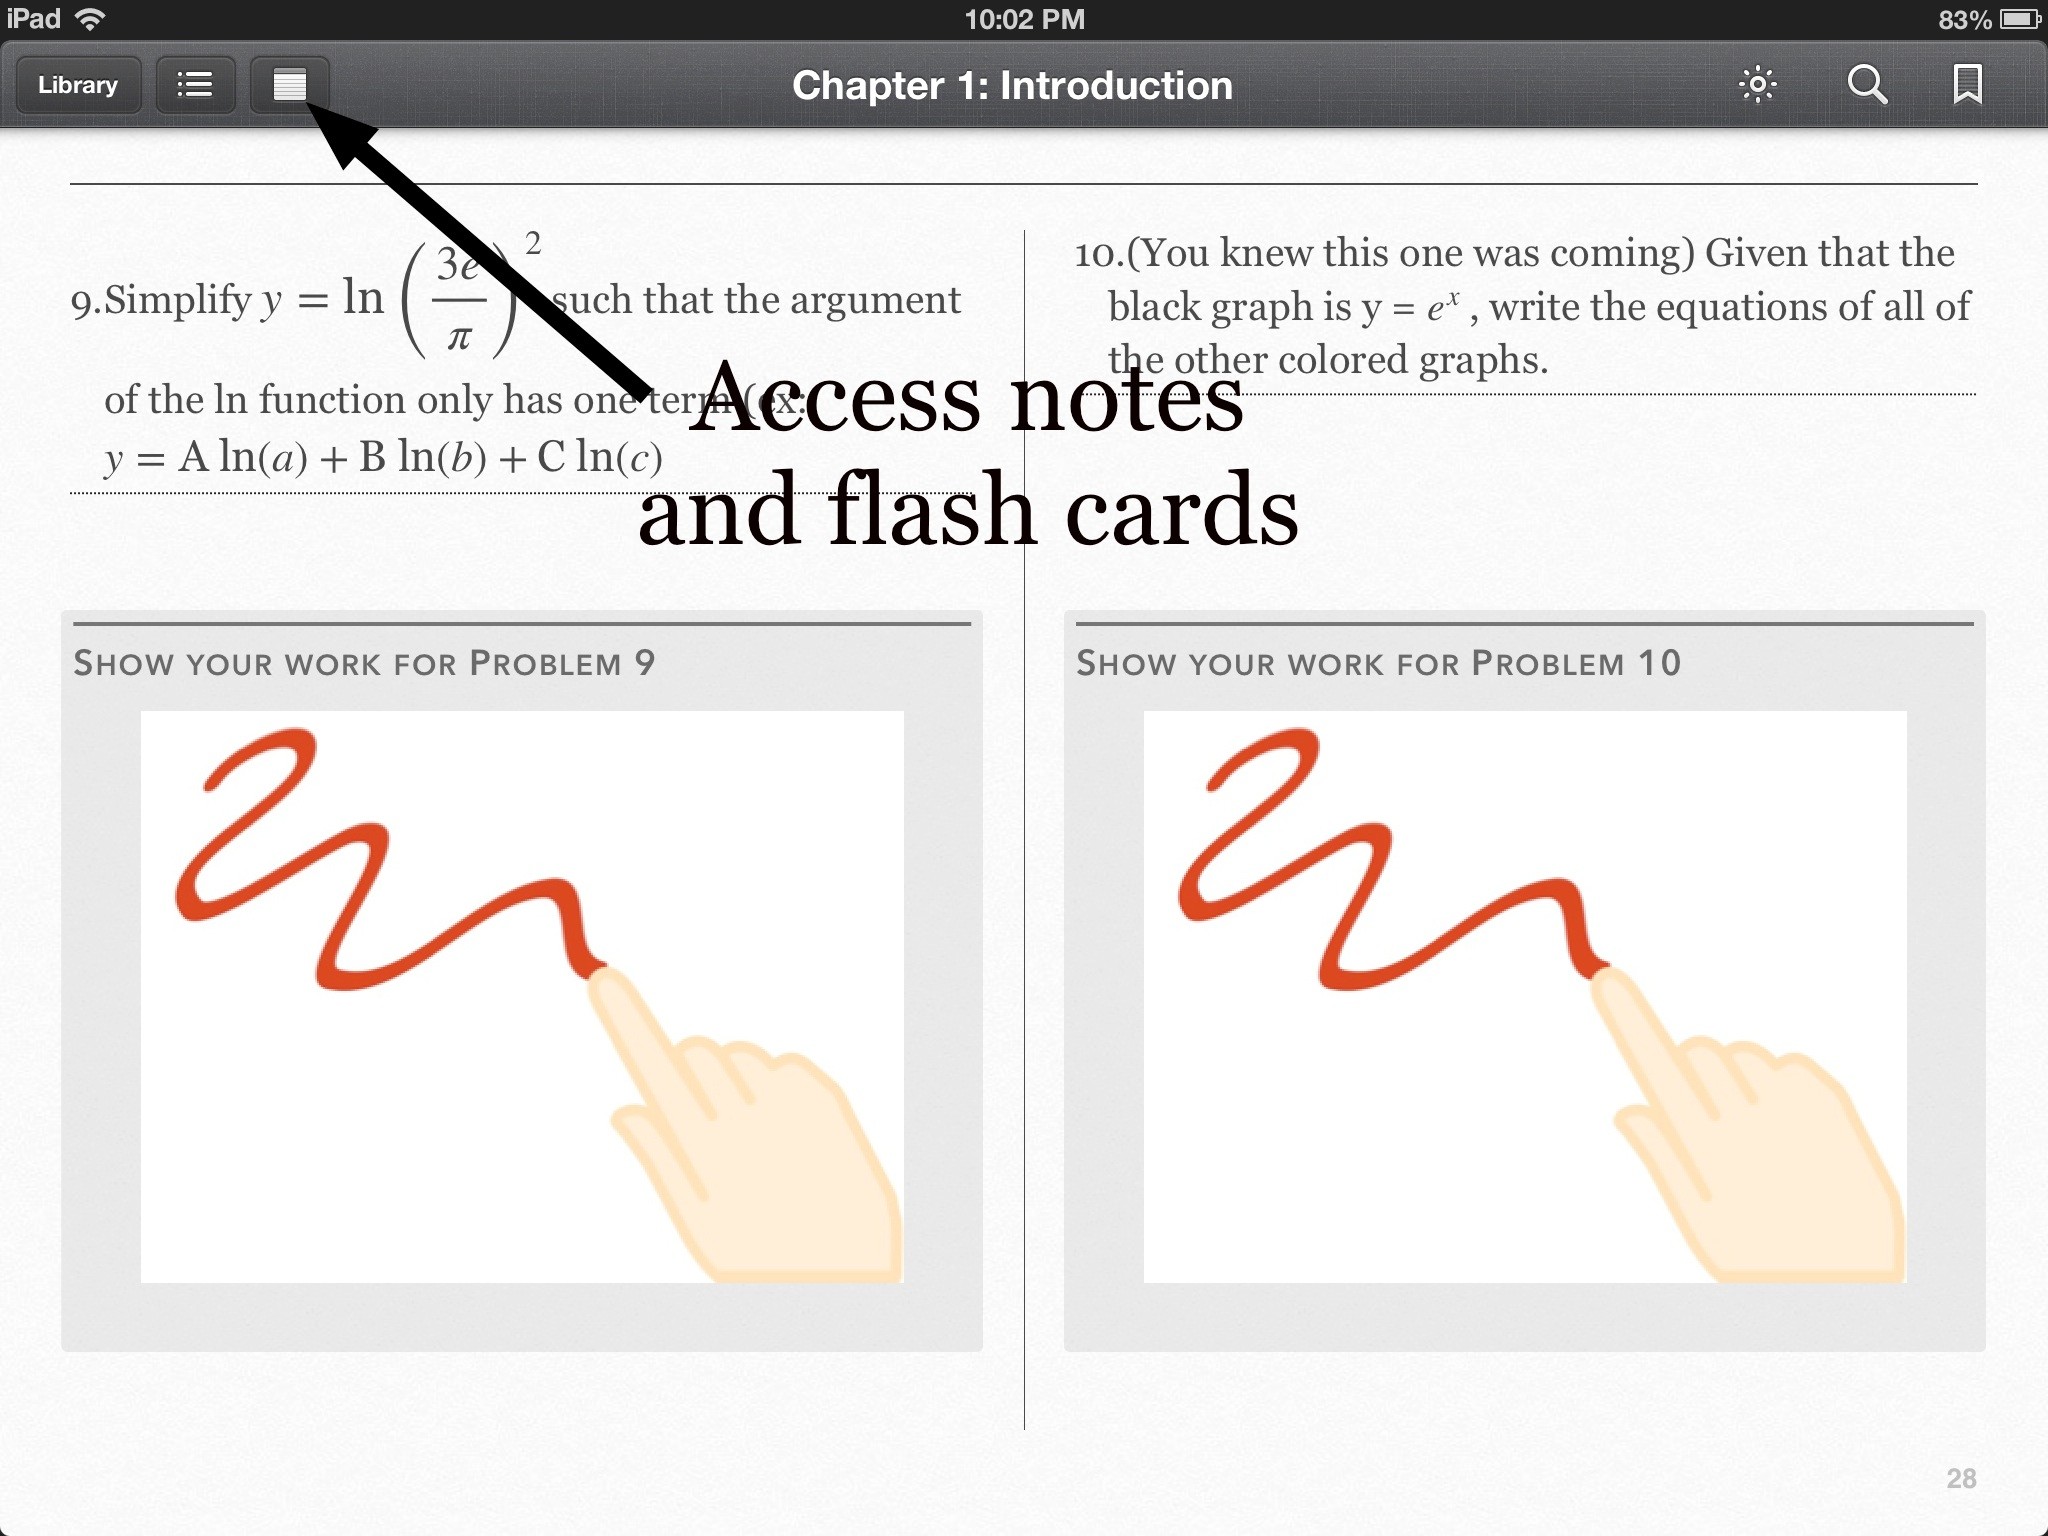
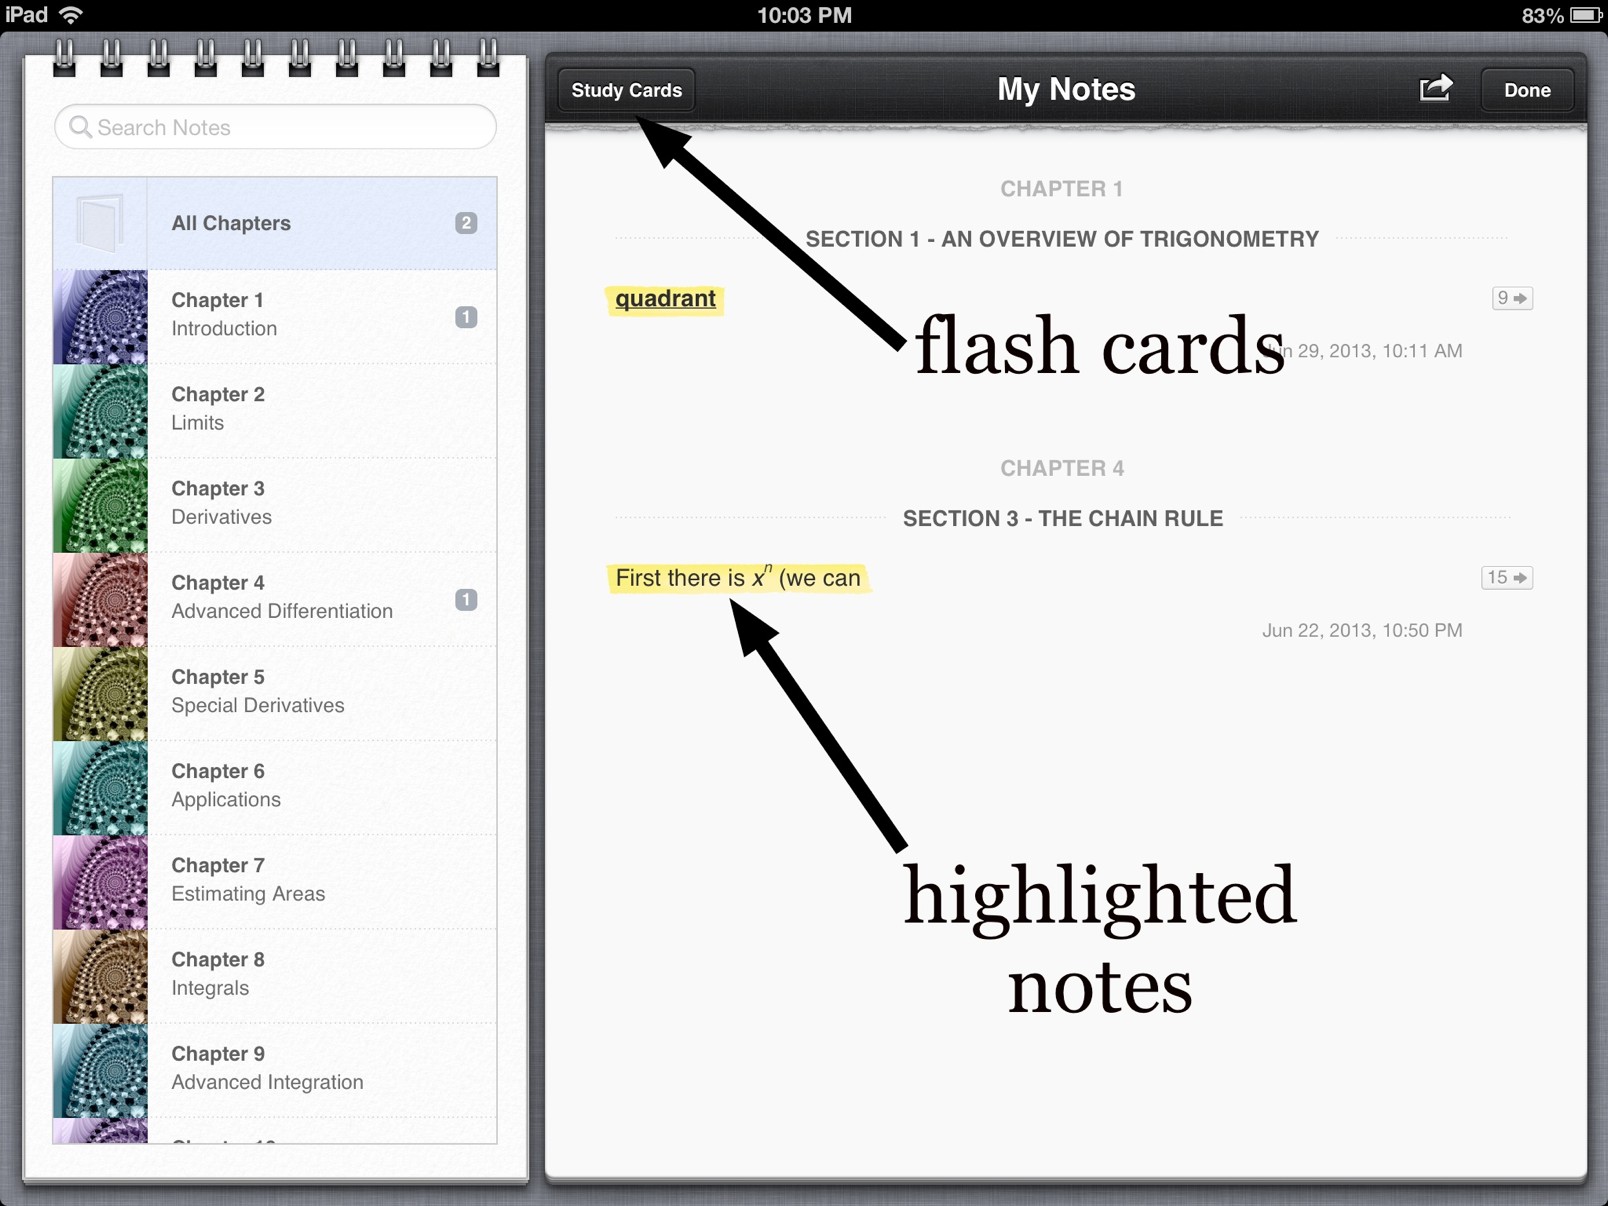
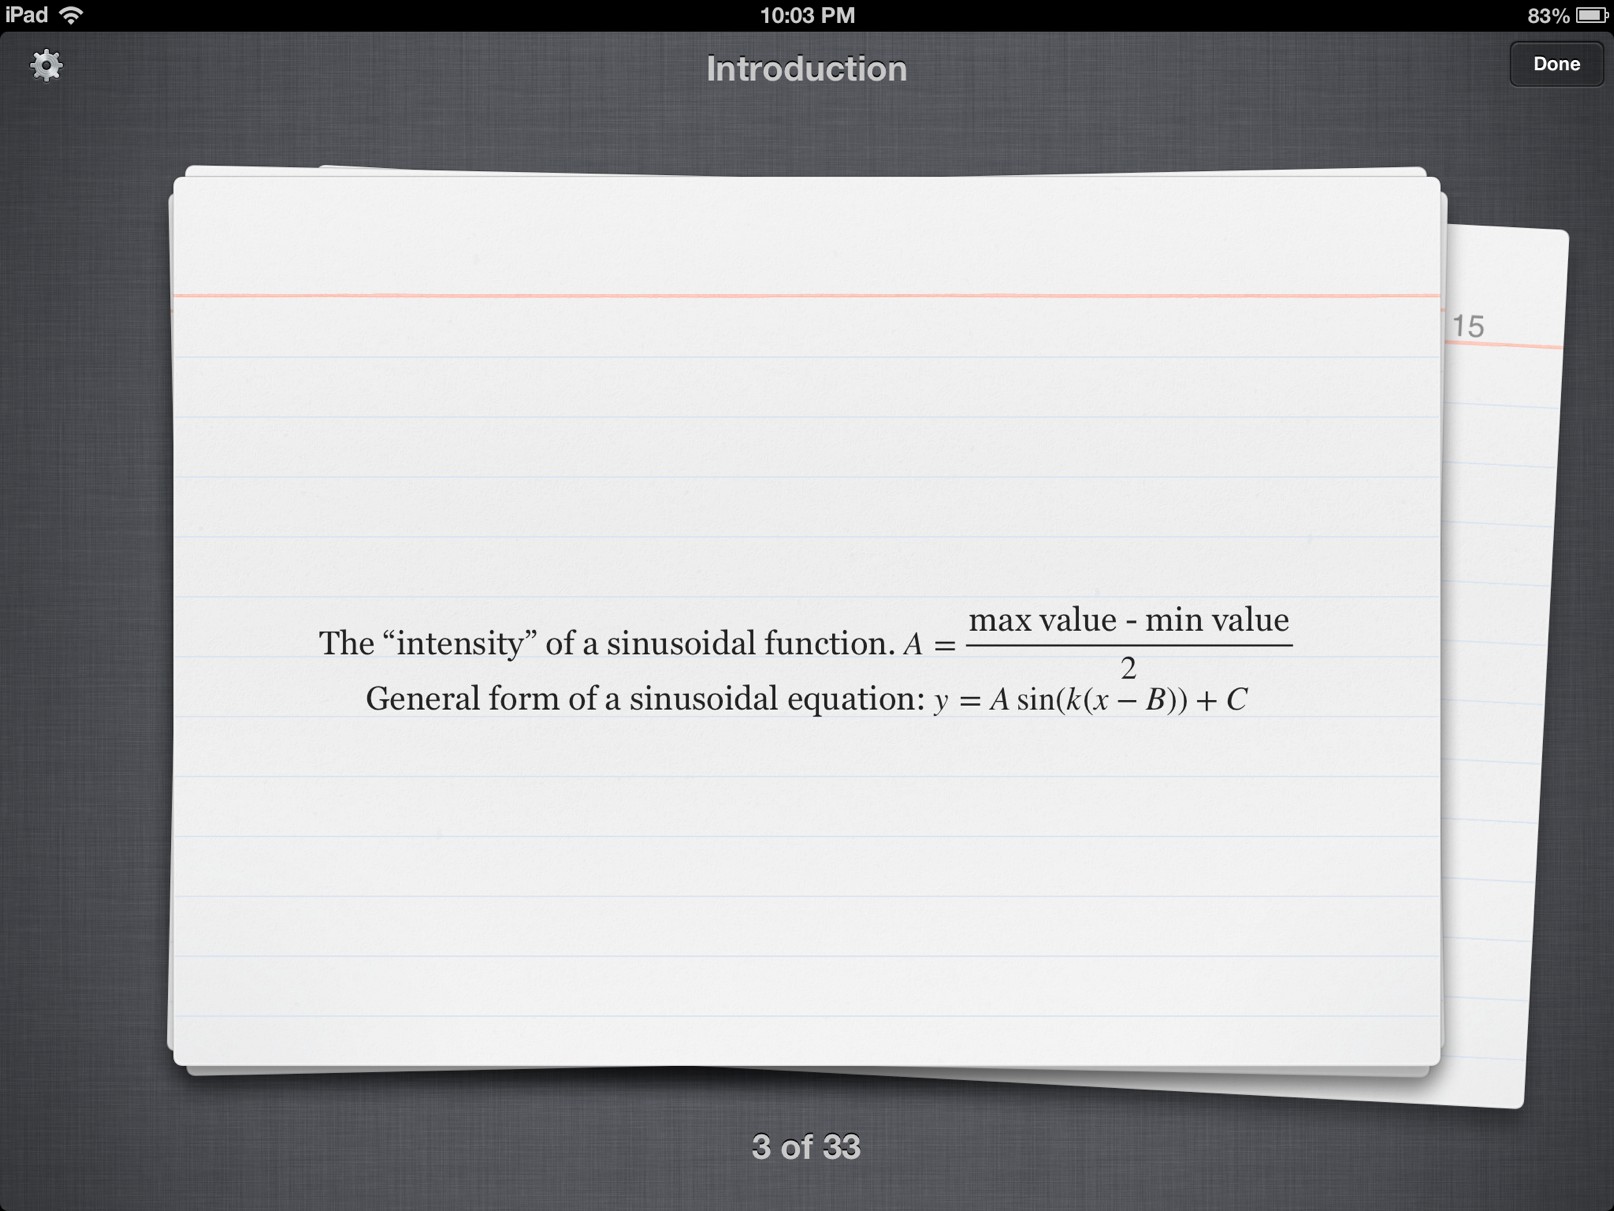
Glossary and deeper reading · 2 refreshers
These editorial refreshers supplement the reading. Definitions and examples are added guidance; original source wording and recorded answers remain in their original context.
-
Unit circle
The unit circle is the circle of radius 1 centered at the origin. At angle θ measured from the positive horizontal axis, its point has coordinates (cos θ, sin θ). For example, θ=π/2 gives the point (0,1), so cosine is 0 and sine is 1. The circle also helps track signs and periodic behavior of trigonometric functions.
-
Logarithm
A logarithm gives the exponent required to obtain a number from a specified base. For real logarithms, the argument is positive and the base is positive and different from 1. For example, log₂8=3 because 2³=8, while ln uses the base e. Logarithm rules convert products into sums and powers into constant multiples, subject to the domain restrictions.