FFR (For Future Reference)
This original textbook reading covers part of the AP topic. Follow the AP course outline for complete topic instruction and practice.
This reading includes verified answer corrections and explicitly stated clarifications.
This section is somewhat unique. At the end of each chapter, there will be a section of important concepts to keep in mind, called “For Future Reference” (FFR). Some of these concepts you may already know, or should know. Others may be additive on the existing information.
In future FFR sections, a range of miscellaneous topics that do not deserve their own chapter will be covered. Since Mathematics builds on itself, it is important to review concepts that will be used in future sections. Here are a list of things you should already know, but are reviewed briefly.
Interactive 1.3.1 Understanding range
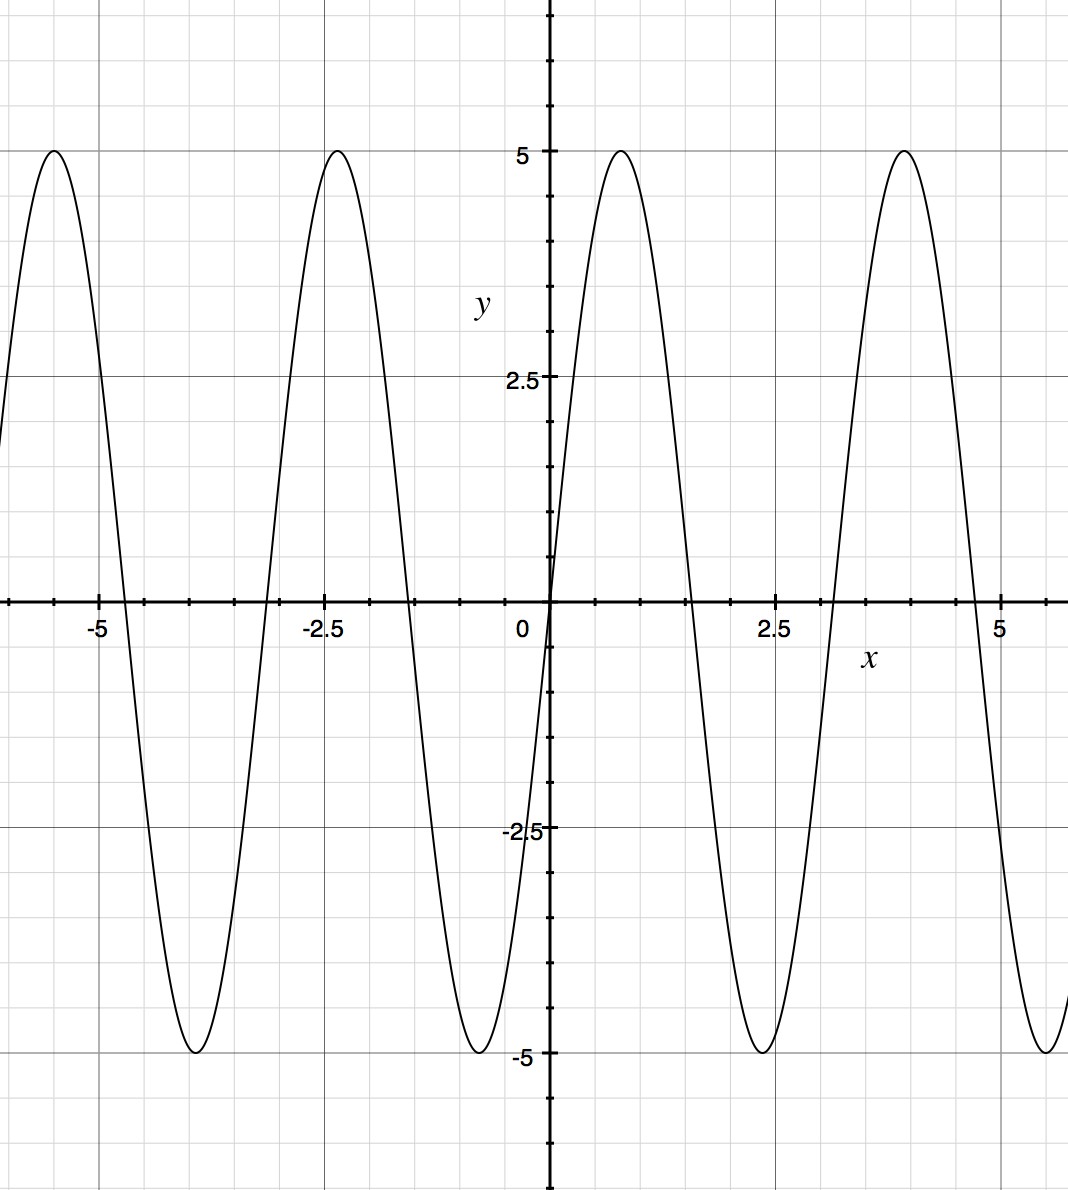
Read all original figure notes
Range Lower Limit
Range Upper Limit
Recall that the domain of a function is made up of all possible x-values you can assign the function without the function being undefined.
The range of a function is made up of all possible values the function can return.
Square brackets vs parentheses: In order to represent the minimum possible range, square brackets ([ ]) are used. When representing a range that the function APPROACHES, parentheses are used as mathematical convention (( )).
Some tips:
- Any value or range of values of x that makes the function undefined is not included in the domain. For example, logarithmic functions have no negative numbers or 0 in their domain.
- Similarly, if a function cannot equal a certain value, no matter what domain (x-value) you give it, then that set of values is not within the function’s range. For example, ex has no negative numbers or zeroes in its range because an exponential function can never be negative.
Interactive 1.3.2 Testing our Prediction from Example Problem 1.3.4
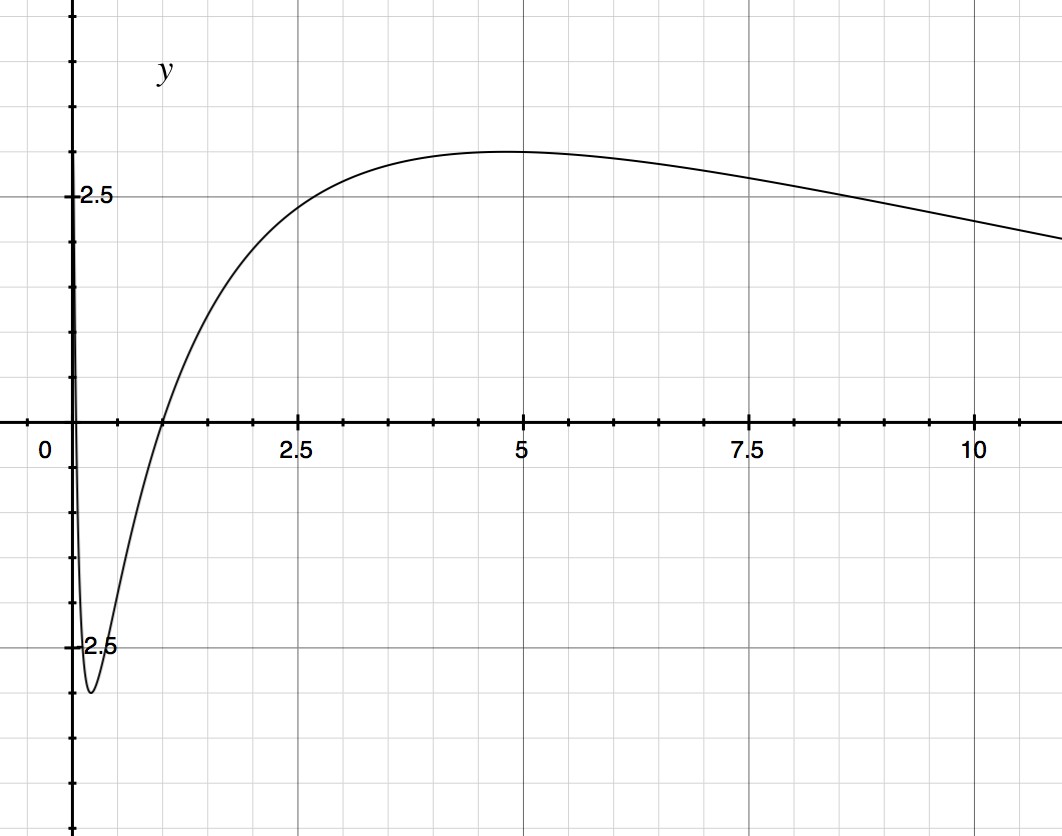
Read all original figure notes
Range lower limit
Range upper limit
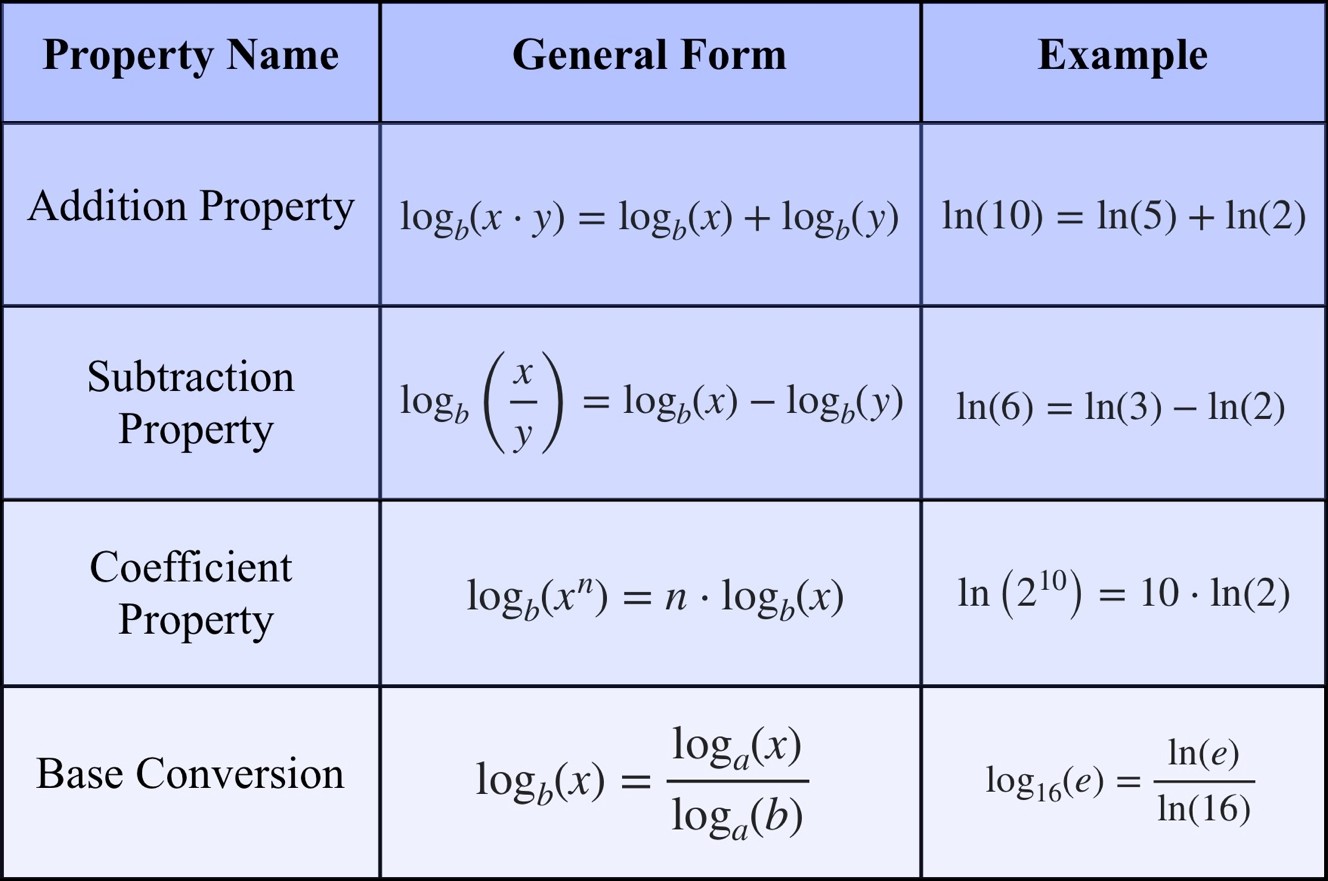
The next important review topic that should be touched upon is logarithm rules. Although you learned about logarithms way back in Algebra 2, some of you might be rusty, like I was when I started Calculus. Listed below are the most common log laws you will use. The most common bases are base 10 and base e (represented by ln). In computer programming, other bases may be used such as base 2 and base 16.
Show your work for Problem 2
Drawing is temporarily unavailable. Work on paper if needed, then record your reasoning here.
Saving written working requires JavaScript. Keep your work on paper or in your own notes; the source problem above remains available.
Show your work for Problem 1
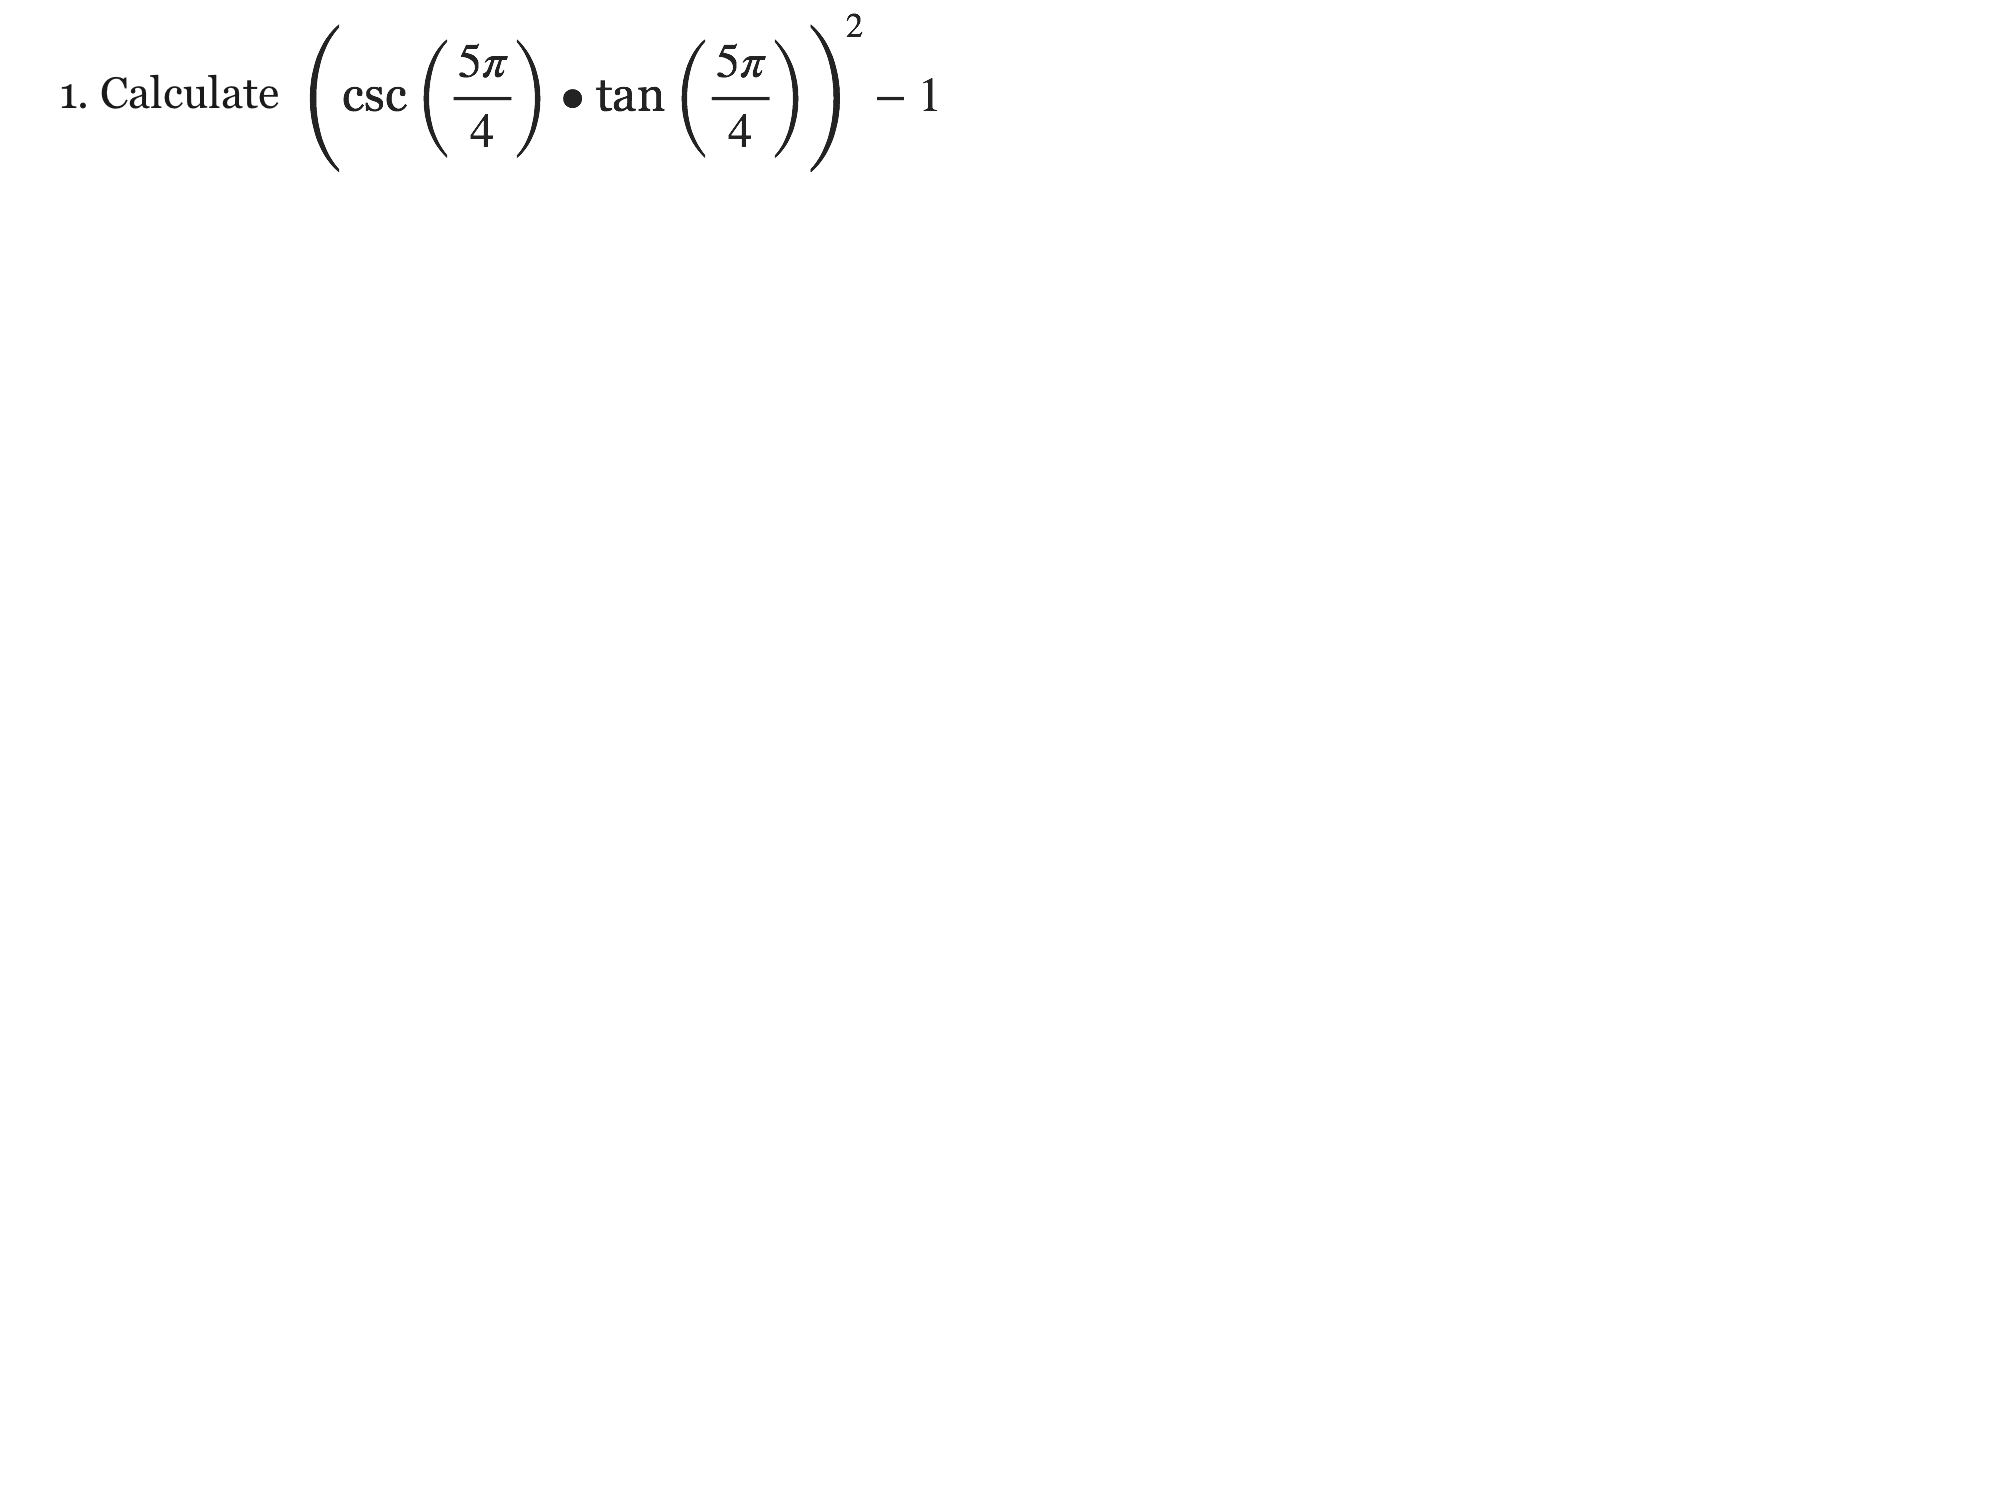
Drawing is temporarily unavailable. Work on paper if needed, then record your reasoning here.
Saving written working requires JavaScript. Keep your work on paper or in your own notes; the source problem above remains available.
Show your work for Problem 3
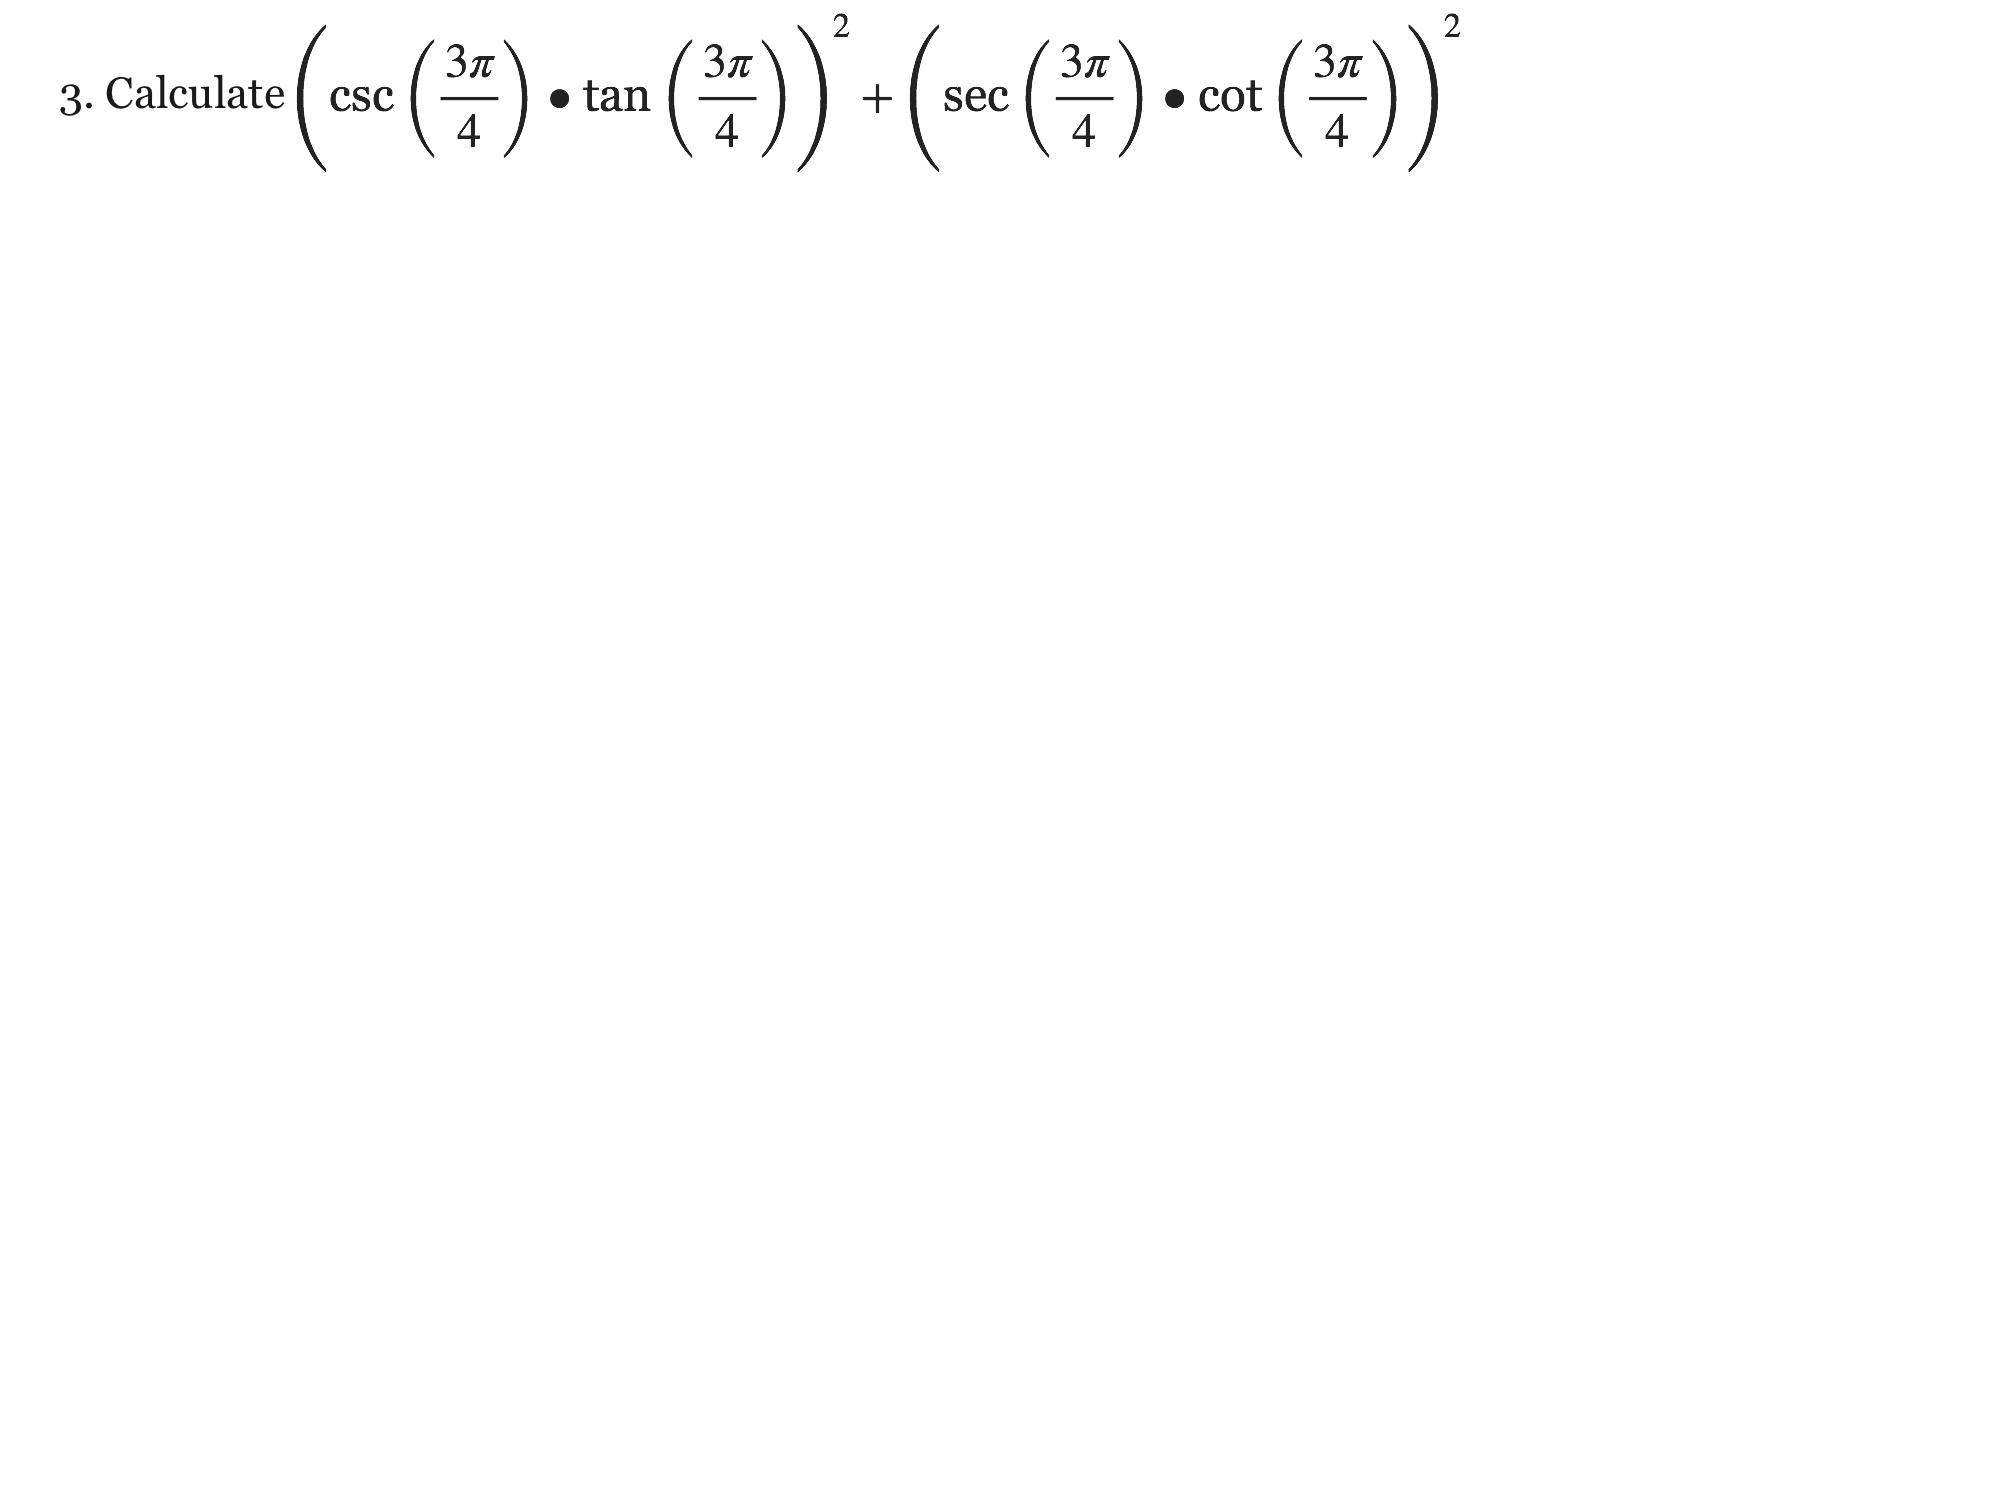
Drawing is temporarily unavailable. Work on paper if needed, then record your reasoning here.
Saving written working requires JavaScript. Keep your work on paper or in your own notes; the source problem above remains available.
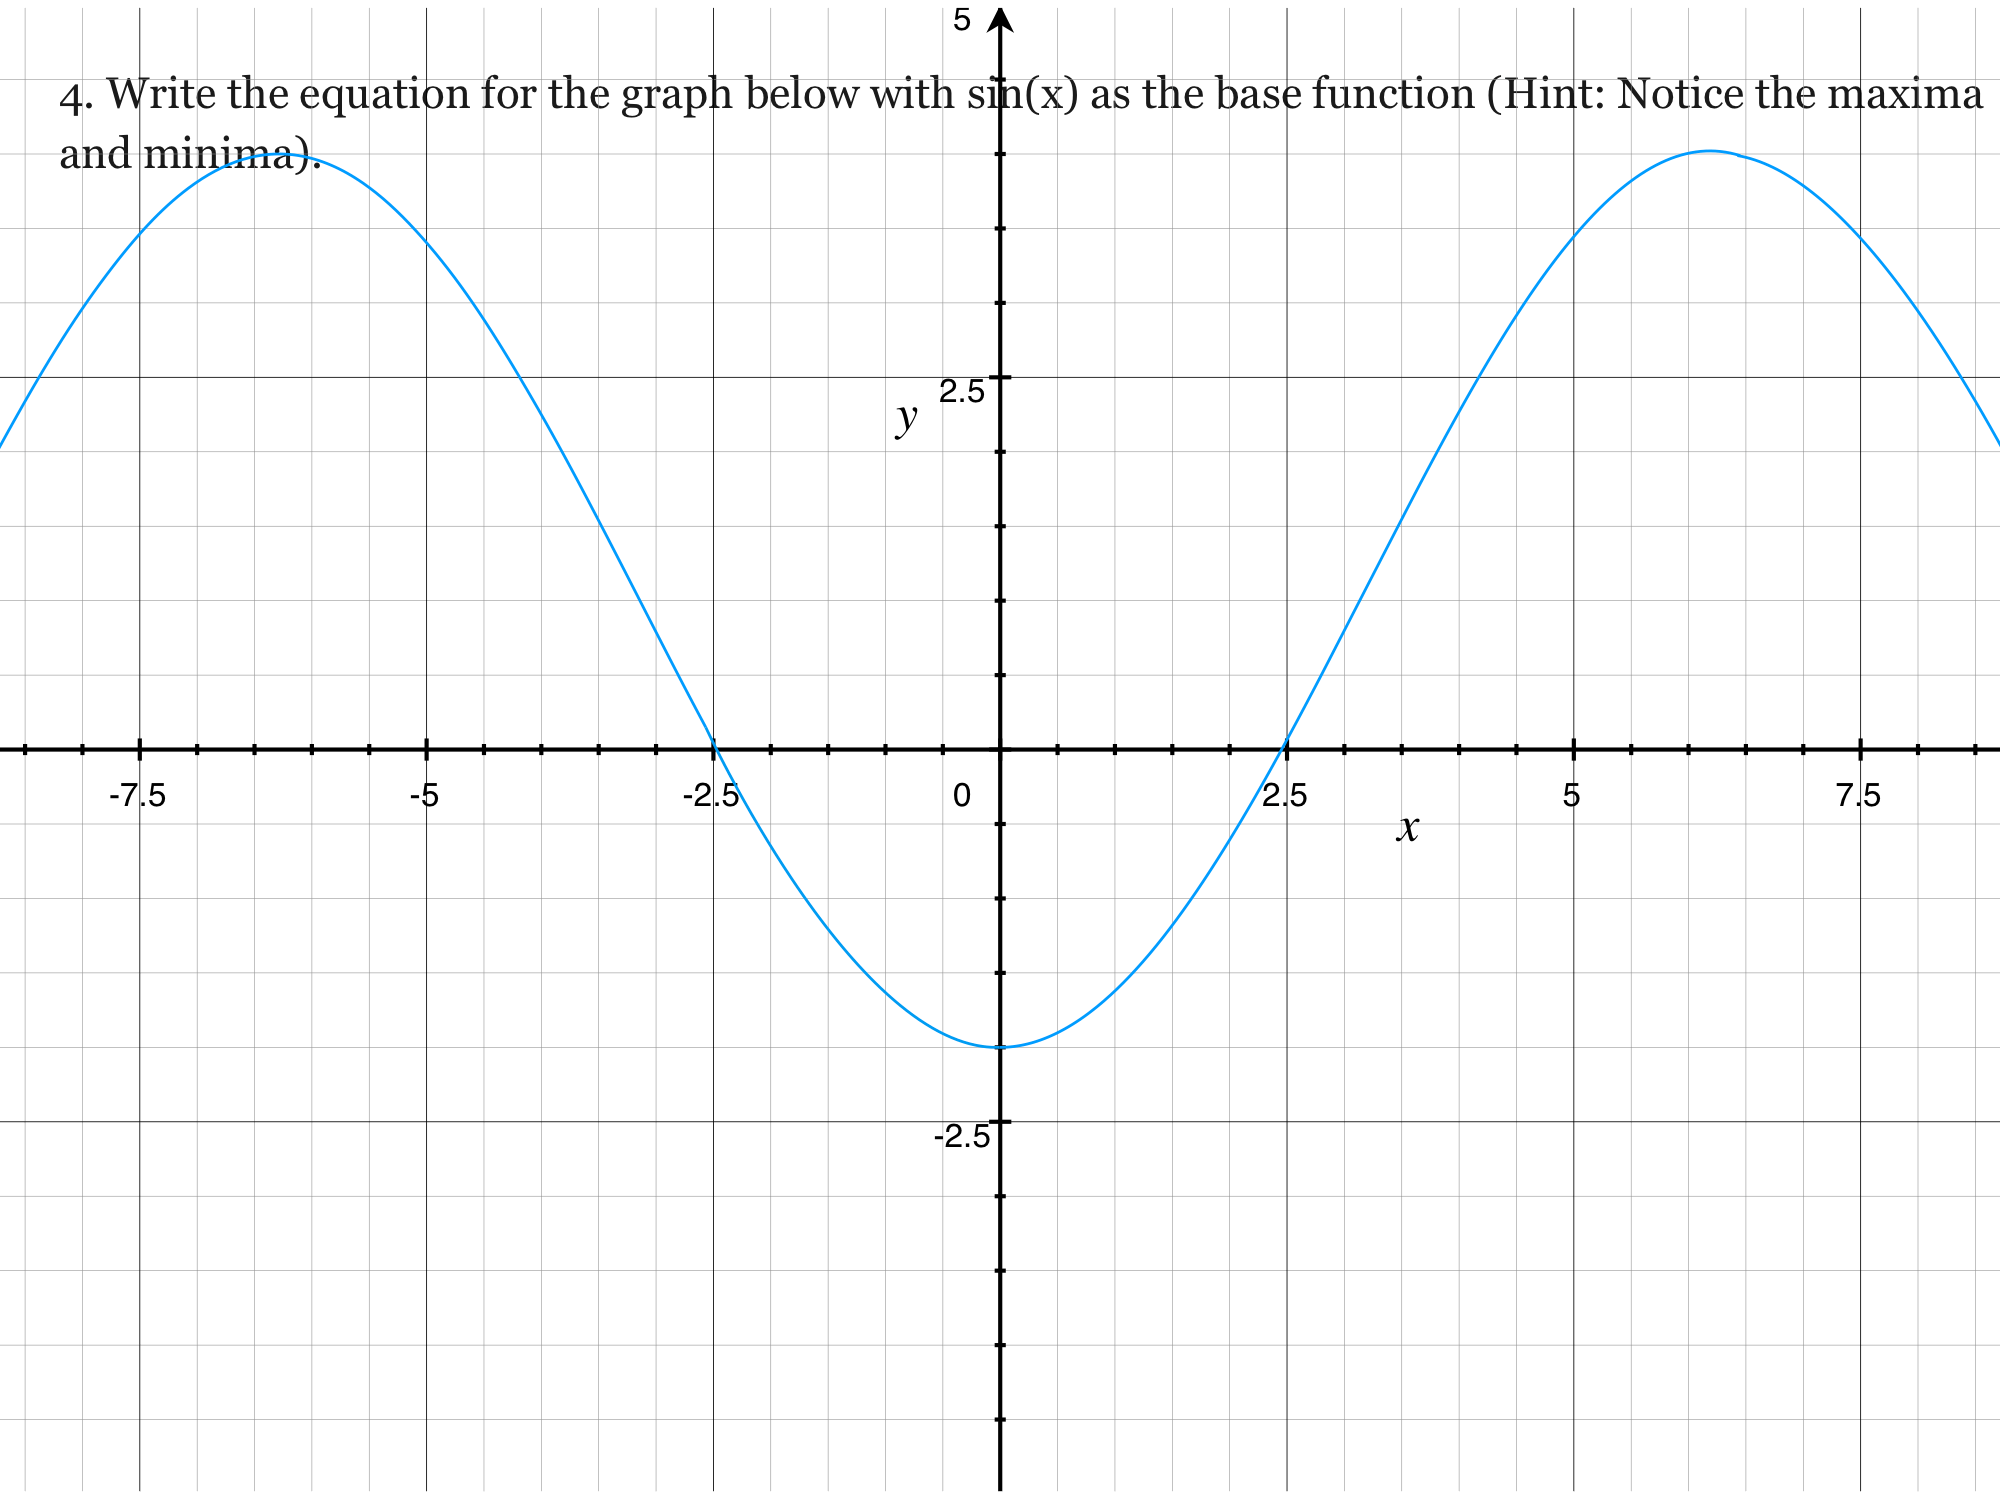
Show your work for Problem 4
Source sinusoidal graph
A blue sinusoidal curve is drawn on a Cartesian grid. The horizontal axis is x and the vertical axis is y. Visible labeled x-values include −7.5, −5, −2.5, 0, 2.5, 5 and 7.5; visible labeled y-values include −2.5, 0, 2.5 and 5.
The curve has a trough on the y-axis at approximately y=−2 and neighboring crests at approximately y=4, near x=−6.3 and x=6.3. It crosses the x-axis near x=−2.5 and x=2.5. The plotted wave is symmetric about the y-axis.
Coordinates not printed next to the extrema are approximate readings from the source raster. No exact symbolic crest positions or period are printed; this description does not supply an unprinted exact period or an equation.
Drawing is temporarily unavailable. Work on paper if needed, then record your reasoning here.
Saving written working requires JavaScript. Keep your work on paper or in your own notes; the source problem above remains available.
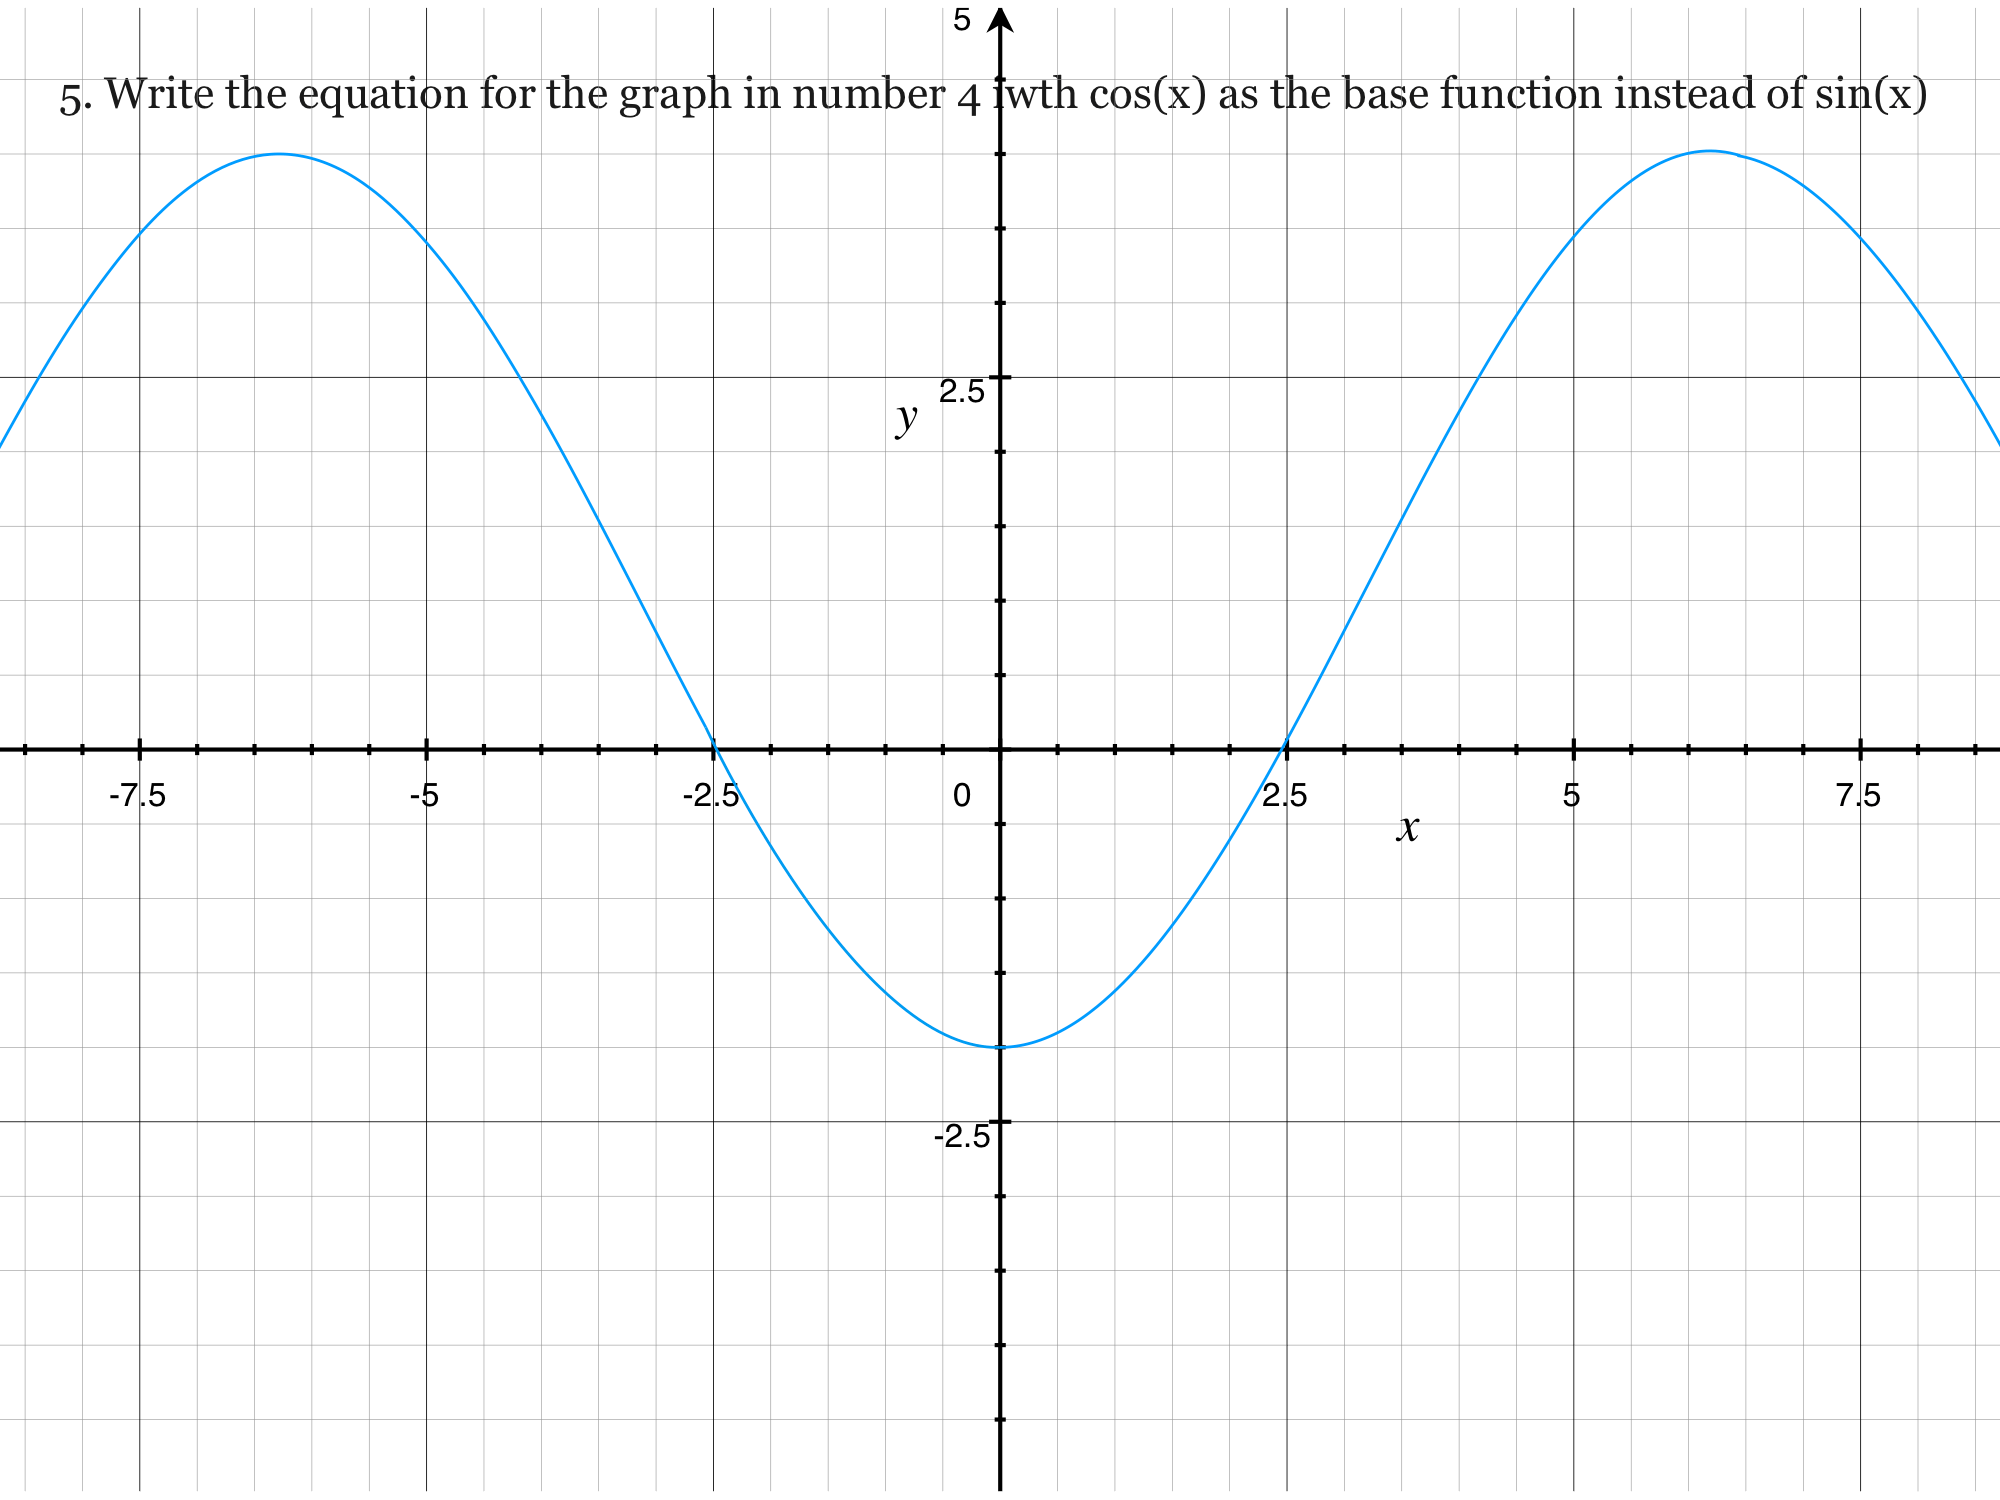
Show your work for Problem 5
Source sinusoidal graph
A blue sinusoidal curve is drawn on a Cartesian grid. The horizontal axis is x and the vertical axis is y. Visible labeled x-values include −7.5, −5, −2.5, 0, 2.5, 5 and 7.5; visible labeled y-values include −2.5, 0, 2.5 and 5.
The curve has a trough on the y-axis at approximately y=−2 and neighboring crests at approximately y=4, near x=−6.3 and x=6.3. It crosses the x-axis near x=−2.5 and x=2.5. The plotted wave is symmetric about the y-axis.
Coordinates not printed next to the extrema are approximate readings from the source raster. No exact symbolic crest positions or period are printed; this description does not supply an unprinted exact period or an equation.
Drawing is temporarily unavailable. Work on paper if needed, then record your reasoning here.
Saving written working requires JavaScript. Keep your work on paper or in your own notes; the source problem above remains available.
Show your work for Problem 6
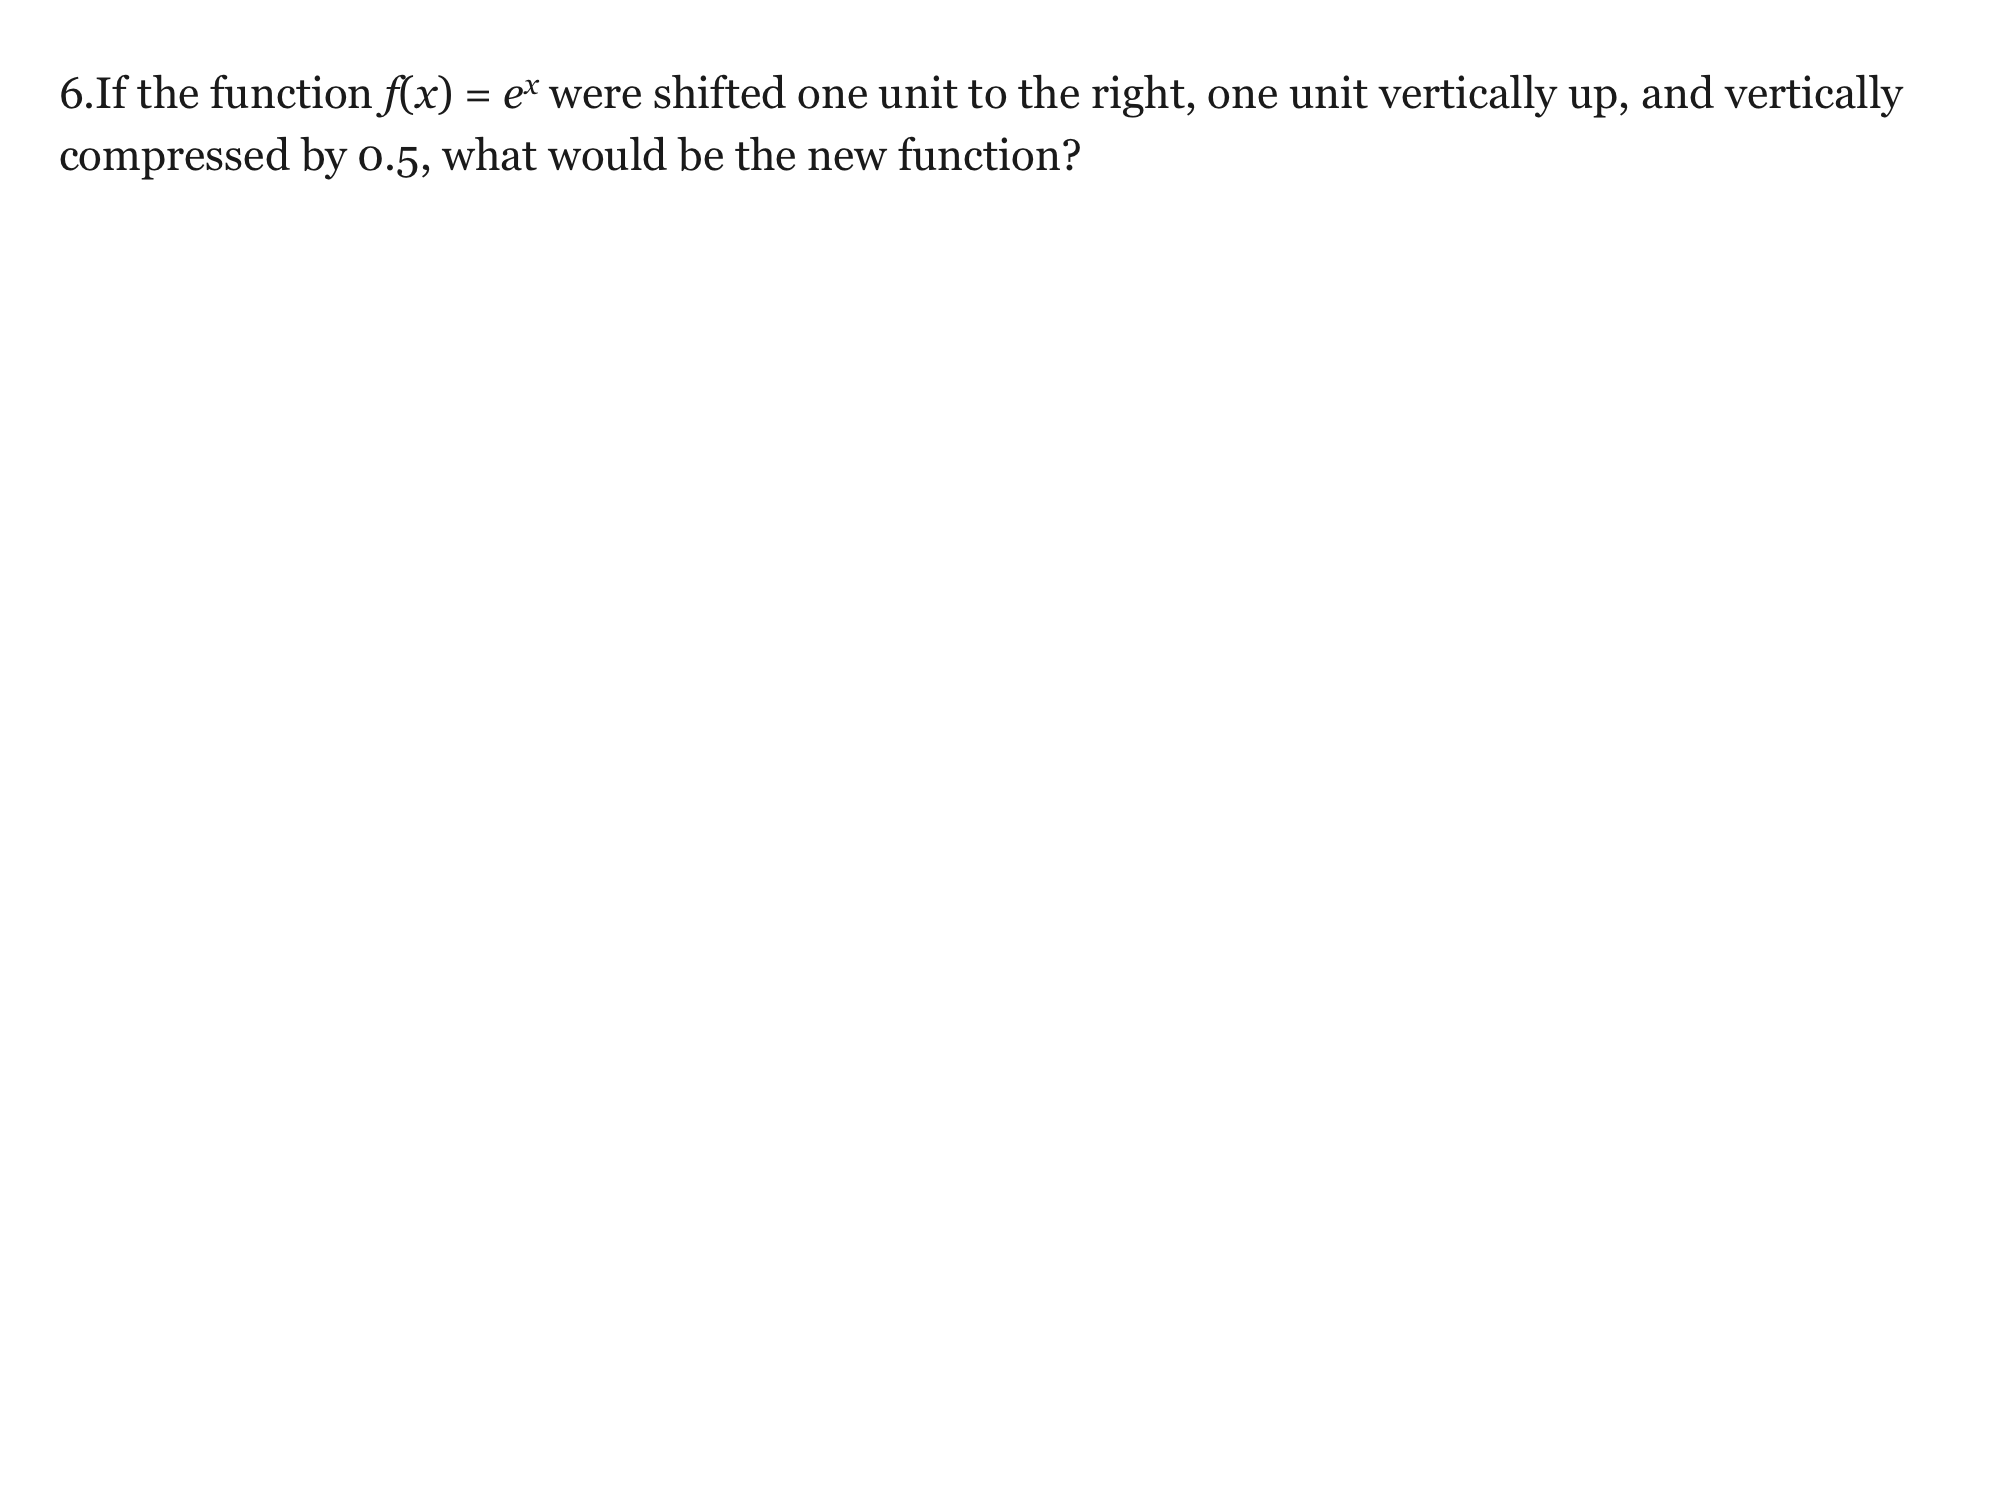
Clarification: Apply the vertical compression before the upward translation; equivalently use the combined transform g(x)=a f(x−h)+k.
Drawing is temporarily unavailable. Work on paper if needed, then record your reasoning here.
Saving written working requires JavaScript. Keep your work on paper or in your own notes; the source problem above remains available.
- Write the equation for the graph in number 4 with cos(x) as the base function rather than sin(x).
- If the function f(x) = were shifted one unit to the right, one unit vertically up, and vertically compressed by , what would be the new function?
Clarification: Apply the vertical compression before the upward translation; equivalently use the combined transform g(x)=a f(x−h)+k.
Show your work for Problem 7
Drawing is temporarily unavailable. Work on paper if needed, then record your reasoning here.
Saving written working requires JavaScript. Keep your work on paper or in your own notes; the source problem above remains available.
Show your work for Problem 8
Drawing is temporarily unavailable. Work on paper if needed, then record your reasoning here.
Saving written working requires JavaScript. Keep your work on paper or in your own notes; the source problem above remains available.
Show your work for Problem 9
Drawing is temporarily unavailable. Work on paper if needed, then record your reasoning here.
Saving written working requires JavaScript. Keep your work on paper or in your own notes; the source problem above remains available.
Show your work for Problem 10
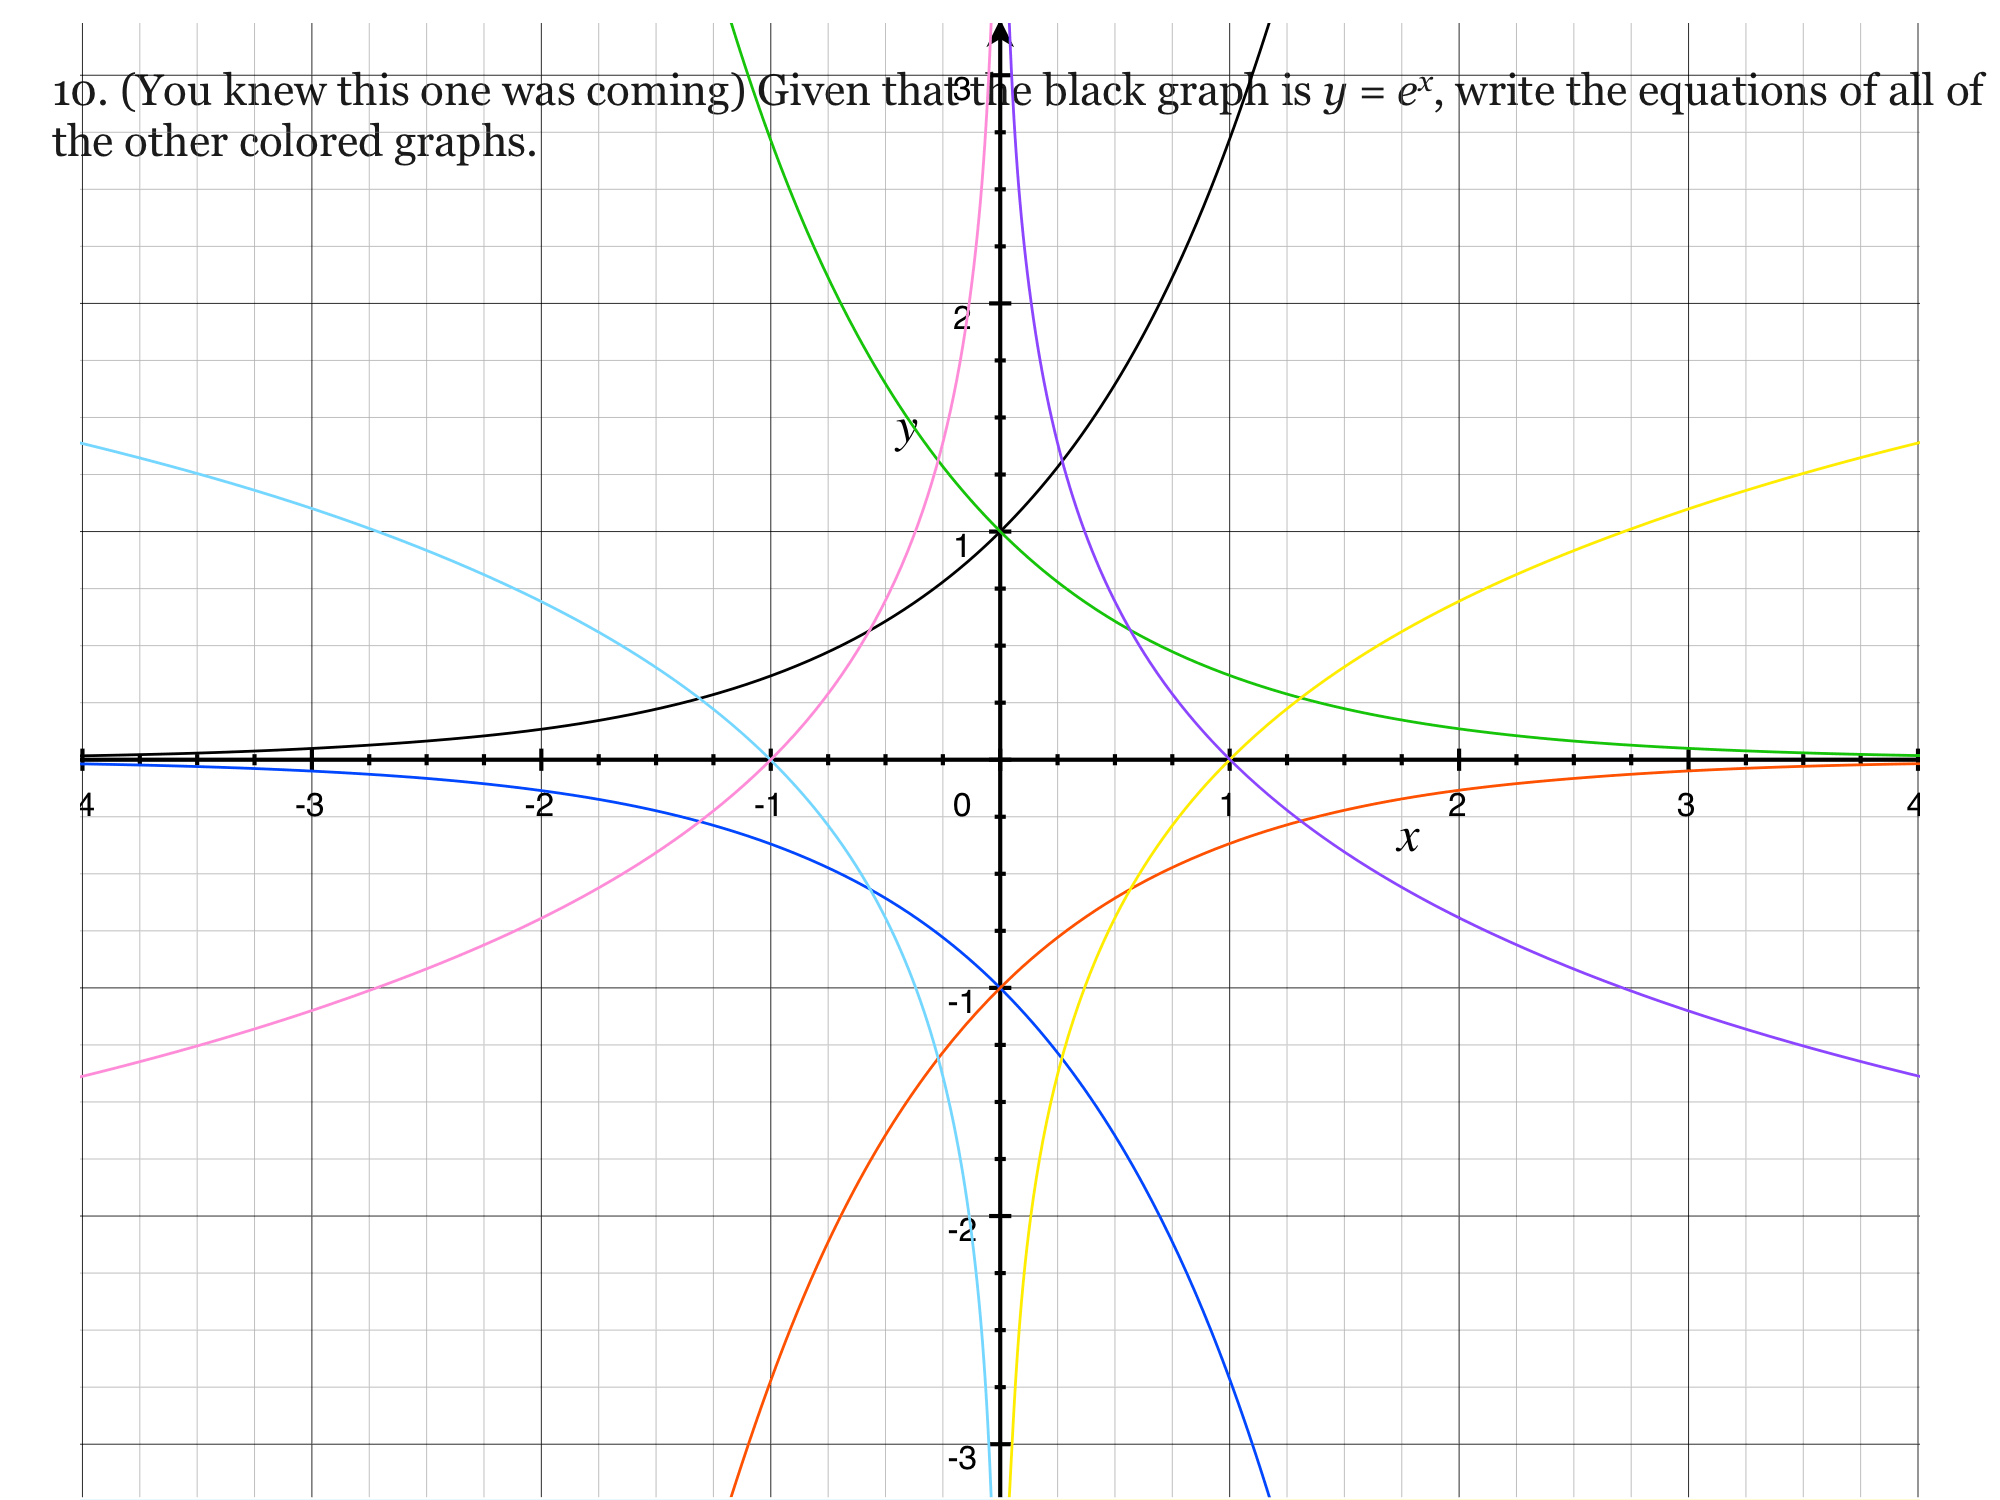
Clarification: Identify the standard exponential/logarithmic reflections that match the labeled raster graph. The equations are inferred from the graph.
Source colored-curve graph
A Cartesian plot shows the black reference curve named in the problem, y=e^x, together with seven colored curves. The displayed x-axis is labeled from −4 to 4 and the y-axis includes labels from −3 to 3. The black curve increases through (0,1).
The green curve is positive, decreases through (0,1), and approaches the x-axis toward the right. The blue curve is negative, decreases through (0,−1), and approaches the x-axis toward the left. The orange curve is negative, increases through (0,−1), and approaches the x-axis toward the right.
The pink curve is drawn to the left of the y-axis, increases through (−1,0), and becomes steep upward near that axis. The cyan curve is also drawn to the left of the y-axis, decreases through (−1,0), and becomes steep downward near that axis.
The purple curve is drawn to the right of the y-axis, decreases through (1,0), and becomes steep upward near that axis. The yellow curve is drawn to the right of the y-axis, increases through (1,0), and becomes steep downward near that axis.
Color, side of the axis, plotted intercepts and visible direction describe the raster. No equations for the seven colored curves or numerical values beyond its labeled grid/intercepts are added.
Drawing is temporarily unavailable. Work on paper if needed, then record your reasoning here.
Saving written working requires JavaScript. Keep your work on paper or in your own notes; the source problem above remains available.
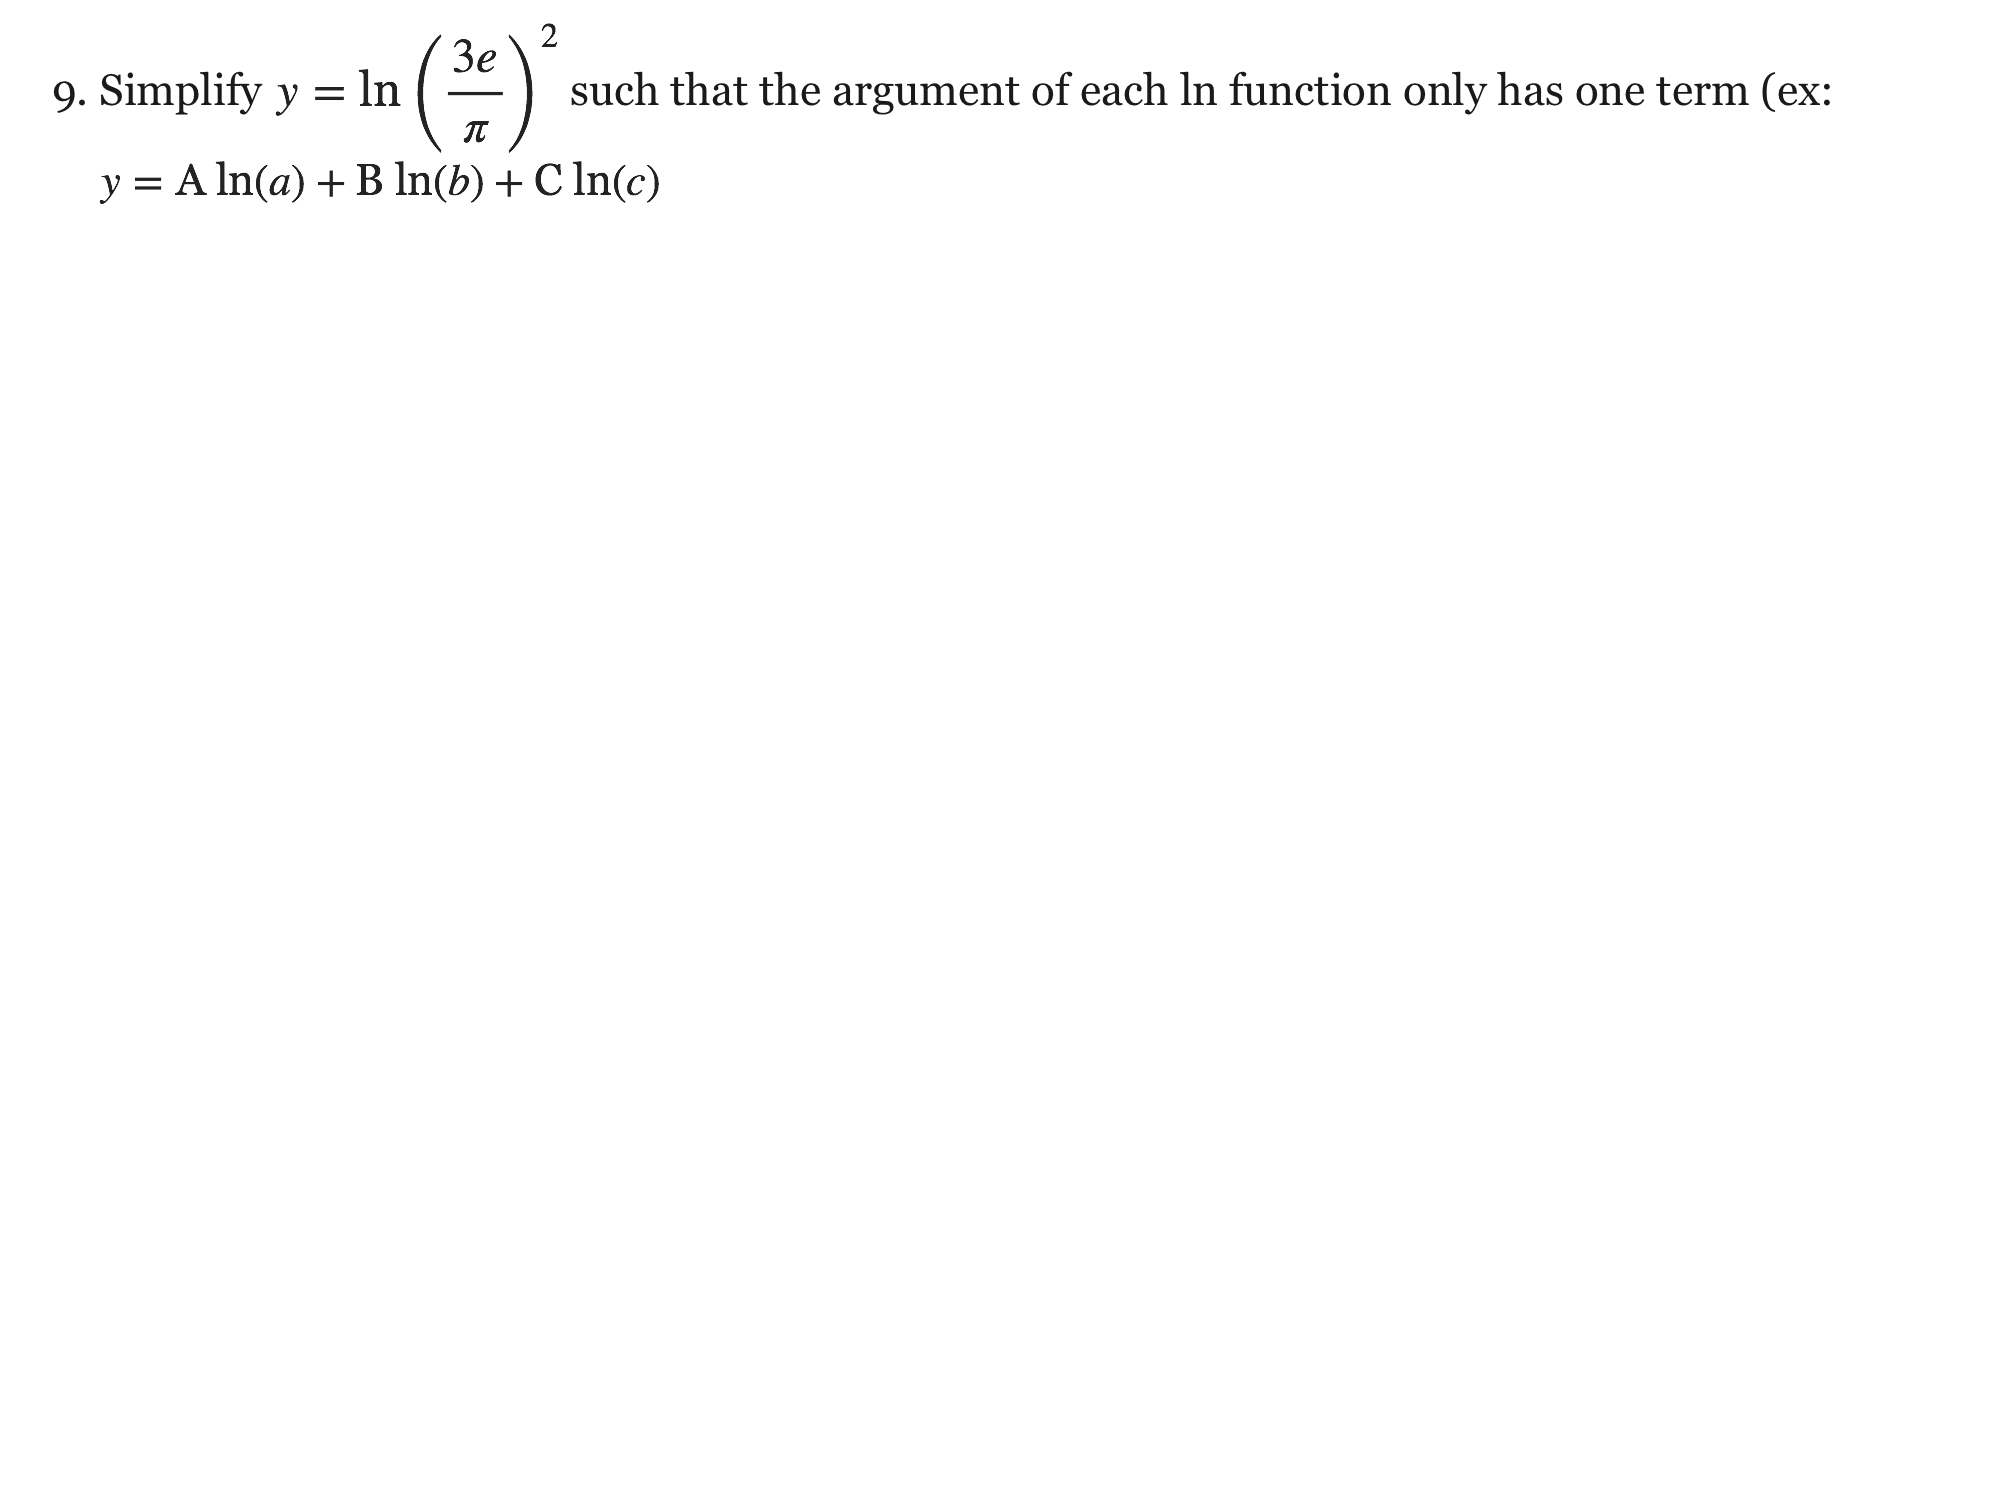
- Simplify such that the argument of the ln function only has one term (ex: . Refer to the log rules
- (You knew this one was coming) Given that the black graph is y = , write the equations of all of the other colored graphs.
Clarification: Identify the standard exponential/logarithmic reflections that match the labeled raster graph. The equations are inferred from the graph.
Glossary and deeper reading · 3 refreshers
These editorial refreshers supplement the reading. Definitions and examples are added guidance; original source wording and recorded answers remain in their original context.
-
Domain
The domain of a function is the set of inputs for which the function is defined. An expression and its context can both restrict the allowed inputs. For example, the real function f(x)=1/(x−2) has domain all real numbers except 2. For a model of elapsed time, a sensible domain may also require t≥0.
-
Range of a function
The range of a function is the set of outputs it actually produces over its domain. It can differ from the set of outputs that were merely allowed when defining the function. For example, f(x)=x² on all real inputs has range [0,∞). Restricting the domain to [1,2] changes that range to [1,4].
-
Function
A mathematical function assigns exactly one output to each input in its domain. Inputs can share an output, but one input cannot have two different outputs. For example, f(x)=x² assigns the output 9 to both 3 and −3. Function notation names the rule and its input; f(3) means the output when the input is 3.